Abstract
Background: Many community health centers (CHC) are scaling social risk screening in response to growing awareness of the influence of social adversity on health outcomes and concurrent incentives for social risk data collection. We studied the implementation of social risk screening in Texas CHCs to inform best practices and understand equity implications.
Methods: Convergent mixed methods of 3 data sources. Using interviews and surveys with CHC providers and staff, we explored social risk screening practices to identify barriers and facilitators; we used electronic health record (EHR) data to assess screening reach and disparities in screening.
Results: Across 4 urban/suburban Texas CHCs, we conducted 27 interviews (15 providers/12 staff) and collected 97 provider surveys; 2 CHCs provided EHR data on 18,672 patients screened during the study period. Data revealed 2 cross-cutting themes: 1) there was broad support for social risk screening/care integration that was rooted in CHCs’ mission and positionalities, and 2) barriers to social risk screening efforts were largely a result of limited time and staffing. Though EHR data showed screens per month and screens/encounters increased peri-pandemic (4.1% of encounters in 8/2019 to 46.1% in 2/2021), there were significant differences in screening rates by patient race/ethnicity and preferred language (P < .001). In surveys, 90.0% of surveyed providers reported incorporating social risk screening into patient conversations; 28.6% were unaware their clinic had an embedded screening tool.
Conclusions: Study CHCs were in the early stages of standardizing social risk screening. Differences in screening reach by patient demographics raise concerns that social screening initiatives, which often serve as a path to resource/service connection, might exacerbate disparities. Overcoming barriers to reach, sustainability, and equity requires supports targeted to program design/development, workforce capacity, and quality improvement.
- Health Care Disparities
- Health Equity
- Implementation Science
- Patient-Centered Care
- Population Health
- Qualitative Research
- Screening
- Social Determinants of Health
Introduction
In striving to improve both care equity and quality, the health care sector is increasingly attending to patient social risk factors, such as food insecurity and unstable housing.1⇓⇓⇓–5 Multiple health professional societies have endorsed health care activities to both identify and mitigate the impacts of patients’ social risk factors.6⇓⇓⇓–10 Enthusiasm for better integrating medical and social care is based on growing evidence that awareness of patient social risks and efforts to address identified social barriers in health care settings can improve patient health and wellness.11⇓⇓⇓⇓⇓⇓⇓⇓⇓⇓⇓⇓⇓⇓⇓⇓–28
Despite the expansion of social risk data collection in clinical settings,29 little existing research has examined clinical factors that contribute to screening integration and reach.30
Community health centers (CHCs), led by the efforts of the National Association of Community Health Centers (NACHC) and the Association of Asian Pacific Community Health Organizations (AAPCHO), have been early adopters of social risk screening.31,32 A set of CHCs in Texas began piloting NACHC and AAPCHO’s Protocol for Responding to and Assessing Patients’ Assets, Risks, and Experiences (PRAPARE) screening tool in 2017.33⇓–35 Building on this work, in 2019, a multi-stakeholder effort between state health plans, the Texas Health and Human Services organization, and the Center for Health Care Strategies, launched the Texas Managed Care Organization Social Determinants of Health Learning Collaborative, to increase state Medicaid health plan adoption of social risk screening and interventions.36 This study explores the implementation of social risk screening in 4 community health centers (CHCs) in Texas to identify the facilitators and barriers to screening reach, adoption, and sustainability in pre- and peri-COVID-19 pandemic periods, and potential impacts on equity.
Methods
We recruited a convenience sample of 4 CHCs in urban/suburban Texas. Sites were initially contacted via a prerecruitment survey distributed to CHC leadership participating in the Texas Community-Centered Health Homes Initiative in June 2019.37 CHCs were eligible for participation if they reported initiatives to screen all or most of their patients using a standardized multi-domain social risk screening tool for at least the 6 months before the prerecruitment survey. Two study sites were using the PRAPARE social risk screen tool; 2 sites had developed their own screening tools. Study sites received a stipend for participating. Each CHC could have multiple clinical practice sites. All study activities were approved by the University of California, San Francisco, Institutional Review Board.
Data Sources
We used a convergent mixed methods design with 3 sources of study data: 1) staff/provider key informant interviews, 2) provider surveys, and 3) patient electronic health record (EHR) data. Staff were health care team members working at the front desk, medical assistants, social workers, community health workers (CHWs), or in other CHC leadership positions. Providers were health care team members delivering direct clinical care to patients and included physicians, nurse practitioners, physician assistants, and dentists. Staff/providers were recruited regardless of their level of involvement with social risk data collection. We recruited a target of 4 staff and 4 providers for interviews at each CHC, with the goal of recruiting until we reached thematic saturation. We recruited all providers at participating CHCs to complete a Qualtrics survey. CHC study site contacts provided e-mail information to recruit eligible participants for individual interviews and surveys.
All research activities were remote. Research staff reviewed study details and acquired informed consent from participants over Zoom before starting interviews. Interviews were designed to take approximately 45 to 60 minutes. Participants self-completed an online consent before starting the Qualtrics survey. Participants could skip any interview or survey question. Study participants received $100 gift cards for participating in interviews and $20 gift cards for completing surveys.
From each CHC, we requested individual-level patient EHR data on patients screened/not screened for the 12 months before the start of the COVID-19 pandemic to the 12 months after the start of the pandemic (03/2019-03/2021). Participation in the EHR data review was not required for study participation. All data collection and analyses were conducted from 11/2020 to 11/2022.
Measures
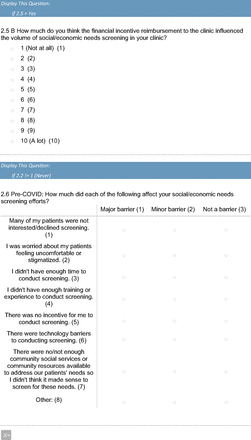
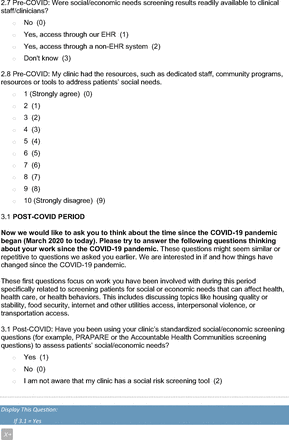
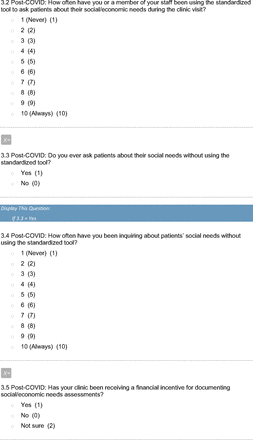
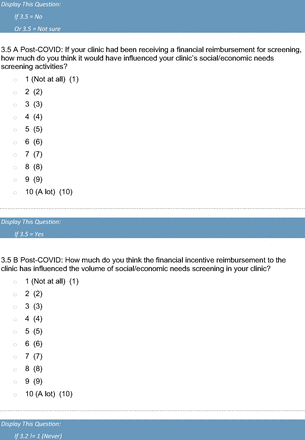
Semistructured interview guides probed on knowledge and perspectives related to CHC’s and individuals’ use of social risk screening tools, barriers and facilitators to social care activities, perspectives on social care integration, and the effect of the COVID-19 pandemic on social care practices. Provider surveys queried individual and clinic-wide social care practices before and after the start of the COVID-19 pandemic, perspectives on social care, and training for social care activities. Participant demographics were asked in both interviews and surveys to enable an analysis of differences in perspectives based on participant characteristics, including race/ethnicity as a proxy for prior experience of racism.38 Interview guides and surveys were piloted at an urban academic family medicine clinic (n = 7; 4 providers, 3 staff) before finalizing. (See Appendix 1 for full text of interview guides and surveys).
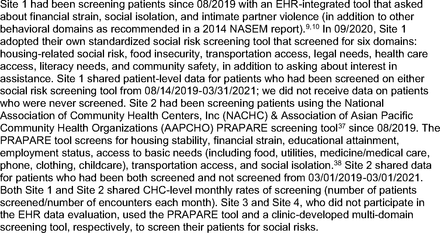
Requested clinic-level EHR data included the number of patient encounters per month and number of administered social risk screenings per month. Requested encounter-level data included patient demographics (age, sex, race/ethnicity [as a proxy for experience of racism38], preferred language), frequency and type of clinic visits, and social risk screening tool results (data entered into structured data fields). To be coded as a social risk screening, screening results had to be documented in the EHR’s structured data fields for more than 1 social risk screening domain; we did not have data to verify if screening occurred without documentation within structured data. Two of the 4 CHCs shared EHR data with the study team. (See Appendix 2 for background on site screening practices). In the other CHC cases, 1 lacked the staff capacity to extract and share EHR data; the other had established rules against sharing deidentified EHR data without patient consent and obtaining patient consent was too resource intensive given limited study funding. Both CHCs that provided EHR data had formal data use agreements in place to protect the sharing of deidentified patient-level data. One study site screened patients using PRAPARE, which includes the social risk domains: housing instability, domestic violence, educational attainment, employment situation, food insecurity, utilities insecurity, transportation insecurity, and lack of access to needed medical services, phone, clothing, childcare. The other study site screened patients using the unique tool they developed that includes the social risk domains: housing instability and quality, community safety, educational attainment, employment situation, food insecurity, utilities insecurity, transportation insecurity, legal needs, and financial strain.
Data Analyses
Deidentified audio recorded interviews were transcribed by Rev.com.39 Three study researchers (EHD, BA, NR) initially reviewed the same 8 transcripts and used inductive coding to develop a preliminary codebook. This codebook was then applied to all transcripts by 2 researchers (EHD, BA) in Dedoose 8.3.41.40 Each researcher independently coded every transcript and met periodically to discuss codes and edit the codebook as needed. Additional study researchers (NR, LMG) helped to resolve coding discrepancies. Basic thematic analysis and constant comparative methods were used to analyze transcripts. Preliminary codes and themes were presented to study site contacts for feedback.
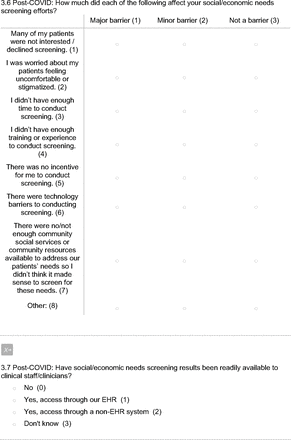
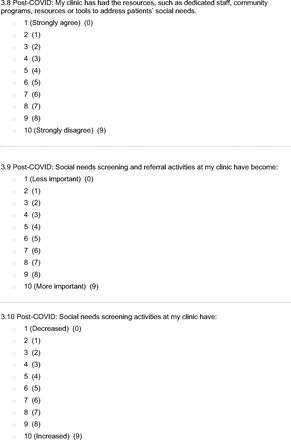
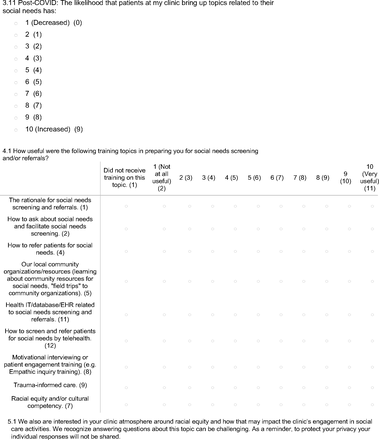
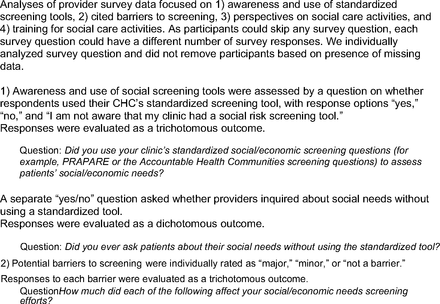
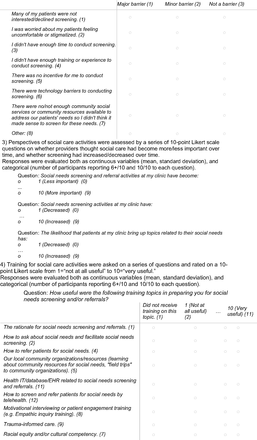
Surveys and EHR data were analyzed using descriptive and Chi-square inferential statistics. Descriptive analyses of provider survey data focused on 1) awareness and use of standardized screening tools, 2) cited barriers to screening (rated on 3-point Likert scale: “Major barrier”/“Minor barrier”/“Not a barrier”), 3) perspectives on social care activities, and 4) training for social care activities. (See Appendix 3 and Appendix Table 1 for additional details on how these survey questions were asked and coded). Descriptive analyses of EHR data focused on evaluating the monthly frequency of social risk screening to look for trends in screening rates per encounters in the pre-/peri-COVID-19 period (CHC-level outcome; includes repeat screenings for patients who were screened more than once over the study period). Chi-square inferential analyses at Site 2 evaluated if/how patient demographics varied between patients who were versus were not screened for social risks over the study period (patient-level outcome; demographics used from the first time a patient was screened if they were screened more than once). We did not evaluate the frequency with which individual patients were screened.
Overview of Three Study Data Sources
Survey Results Relevant to Screening Practices Across Four Study Sites (N = 97 Providers)
Continued
Demographics of Patients at Two Community Health Centers (CHCs) That Participated in Electronic Health Record (EHR) Data Analyses
Data sources were combined to identify cross-cutting themes. Interview, survey, and EHR data were analyzed first independently and then in comparison to complement and inform each other.41,42 This convergent mixed method design was appropriate and desirable for a descriptive case study where the focus was on understanding different aspects of screening for social care. We followed current mixed methods manuscript preparation and reporting guidelines.43
Results
Across the 4 CHCs, we conducted 27 key informant interviews (n = 15 providers, 12 staff). [Table 1]. Ninety-seven of 321 eligible providers completed a survey (average response rate 30.2%; range by CHC 24.7 to 47.0%). [Table 2]. EHR data were available for 43,871 unique patients who had at least 1 encounter at CHC Site 1 or 2 between August 2019 and February 2021. Of these patients, 18,672 were screened at least once for social risks, 4283 of whom had screened positive for ≥1 social risk factor (22.9%).
Demographics of Participating Staff (N = 12 Interviews) and Providers (N = 15 Interviews; 97 Surveys)
CHCs in the study served demographically different populations; adult patients screened from Site 1 had a greater preference for both English and Spanish language compared with Site 2 (63.9% English and 35.6% Spanish, vs 52.1% English and 23.6% Spanish, respectively). More patients identified as non-Hispanic Asian at Site 2 (22.9% vs 6.6% at Site 1). (Appendix Table 2).
Mixed methods analyses of data across the 4 CHCs surfaced 2 main themes: 1) there was broad support for social risk screening/care integration that was rooted in CHCs’ mission and positionalities, and 2) barriers to social risk screening efforts were related to lack of time and staffing and contributed to downstream inequities in screening reach. [Table 3]. Survey and interview findings did not vary by participant demographics. Study site feedback in the coding process provided verification of findings and did not change any codes or subsequent thematic development.
Study Themes with Supporting Data
Theme 1: Broad Support for Social Risk Screening/Care Integration
In interviews and surveys, participants from the 4 CHCs expressed support for integrating social risk screening into clinical activities. In interviews, there was recognition across participant type that patients were experiencing social risks that adversely impacted health, and it was therefore important that the health care team be aware of patients’ social context. As 1 provider put it, “I do feel it is a huge part of the medical visit in the sense that I can treat the medical aspect of their care, but if there are social determinants [affecting] that care, then I am not going to be able to effectively treat the medical aspects.” Moreover, being aware of and responsive to patients’ social risks was seen as core to the underlying mission of the CHCs. Interviewees consistently noted that trusting and longstanding patient-/community-health care team relationships facilitated social risk screening, as did the related fact that many CHC employees were from the community. A staff member noted, “And that is the spirit that is reflected in our doctors. That is the spirit that is reflected on our medical teams and front desk teams. Because, like 50% of them are from the community itself. So they do understand the pulse of the community.” Support for social risk screening was reflected in provider surveys where 90.0% of participants (n = 81/90) reported asking about social risks during their clinical conversations. See Appendix Table 1 for full survey responses.
EHR data available from Sites 1 and 2 demonstrated that both the number of screenings administered each month and the rates of screening per clinical encounter increased over time, including after the start of the COVID-19 pandemic. Provider survey responses across study sites confirmed the reported COVID-related increase in screening rates (Figure 1, Appendix Table 1). In interviews, these increases were attributed to many factors, 1 being that some CHCs expanded pilot, single site screening initiatives to additional clinical sites. The increase in screening numbers took place in the context of an overall decrease in total patient encounters (mean, 9506.0 encounters/month pre-3/2020; mean 6723.4 encounters/month post-3/2020), which interviewees attributed to the COVID-19 pandemic in winter/spring 2020 and a state-wide natural disaster in 02/2021.44 Although interview participants acknowledged that social risk screening efforts were paused temporarily across sites at the start of the pandemic, all 4 CHCs restarted screening efforts shortly thereafter. One CHC launched an initiative to screen patients via text messaging. This strategy stemmed from the staff’s recognition that the pandemic had contributed both to new patient financial burdens and reduced the number of clinical encounters.
Trends in number of monthly encounters and social risk screenings at 2 community health centers (CHCs) August 2019 to February 2021.
Theme 2: Barriers to Social Risk Screening Efforts Were Related to Lack of Time and Staffing and Contributed to Downstream Inequities in Screening Reach
Lack of time and staffing for screening were the most consistently reported barriers to social risk screening and influenced the other barriers mentioned in interviews, for example, lack of resources to address patient needs and lack of training to screen. On surveys, 80.7% of providers (n = 67/83) reported that time was a barrier to screening; 54.2% reported it was a “major” barrier (n = 45/83). The primary modality of screening across sites was self-complete by article that was later entered into the EHR by staff. At 1 CHC, screenings were temporarily self-completed using a QR code sent to patients by text message. That same CHC also had medical assistants ask patients the screening questions during rooming in video or telephone visits but noted that visits were primarily in person throughout the study period (limited virtual care was noted by respondents across study sites related to patients’ experience of digital exclusion). Interviewees highlighted not only the actual time it took to screen patients but also the time associated with follow up of positive screening results. As 1 provider noted, “[T]hey're able to fill out the questionnaire before their visit with me. But I rarely actually have time to go over it unless the patient brings up specific issues.” Interviewee perceptions of the time limitations for social risk screening were influenced by whether they perceived social care as part of medical care, or as a separate/additional service. Viewing medical and social care as separate services generated more tension for providers/staff as they prioritized their clinical obligations; in these cases, screening was seen as taking time away from medical care, as summarized by 1 provider: “I think the negative is staff and [clinicians] are stretched to the brim with trying to get all this data, but not necessarily being helpful for what [patients are] coming in for at that time.”
In surveys, other barriers noted by more than half of the surveyed providers included: 1) lack of community services/resources to address identified patient needs (25.0% major barrier; 38.1% minor); 2) technology (23.2% major barrier; 36.6% minor); 3) lack of training/experience to screen (20.2% major barrier; 35.7% minor); and 4) lack of patient interest in screening (4.8% major barrier; 47.6% minor) (Appendix Table 1). In interviews, participants recognized that lack of time and staffing were often the root cause of these barriers. For example, providers/staff noted general frustration at the lack of accessible resources for patients and wanted to avoid screening unless they could provide assistance for any identified needs. This led to calls for colocation of social and medical services and additional funding for designated staffing, primarily CHWs, to assist patients with resources. At sites where screening was done on article or results were otherwise documented separately from the EHR, staff noted the extra time burden associated with manually entering results into EHRs. Some interviewees also noted that clinic leadership emphasized social screening only intermittently, largely based on competing clinic priorities. Lack of consistent reinforcement meant screening did not become routine practice. This was highlighted in the finding that 28.6% (n = 26/91) of providers were not aware that their clinic had a social risk screening tool.
In interviews, providers and staff acknowledged changing screening behaviors based on patients’ language, literacy, and cultural demographics. This was largely because of time and staff availability.
There are a lot of patients who unfortunately I’m sure have a lot of social determinants of health needs that aren’t being addressed … [Patients are] handed a lot of paperwork at intake. […] if they’re unable to read or write…the medical staff is very busy. And so they may not take the time out to read it to them and read the questions. –Staff
EHR screening data similarly indicated that patient factors influenced whether screening was completed. In the 1 CHC that was able to share demographic information for both patients who were and were not screened (Site 2, 35,635 patients), we found statistically significant differences in EHR-documented screening data by patient age, sex, race/ethnicity, and preferred language (Figure 2), even though screening was intended for all patients during visits. Patients identified as non-Hispanic White and non-Hispanic Black were more likely to be screened than Hispanic and Asian patients (32.9% and 34.1% vs 20.6% and 18.7%, respectively [P < .001]). Patients who preferred to speak English and Spanish were more likely to be screened than Arabic and Chinese-preferred patients (33.4% and 33.6% vs 18.1% and 11.9%, respectively [P < .001]). [Table 4] Some of the differences in screening by patient age/sex were in part explained by screening implementation decisions noted in interviews. For example, 1 clinic at Site 2 was initially only screening prenatal patients, which likely contributed to the site findings that female patients aged 18 to 44 were screened more frequently than male patients and patients under 18 or over 65. This CHC reported having staff who were language- and culturally-concordant with many, but not all, of the patients served by the CHC, and had access to phone interpreters.
Proportion of patients screened for social risks at least once at Site 2, stratified by patient demographics (n = 10,436 patients).
Differences in Demographics of 10,436 Patients with ≥1 Documented Social Screen Compared to 25,199 Patients Never Screened at Site 2 (n = 35,635)
Discussion
In this study of 4 CHCs in Texas, interviews and surveys of providers and staff revealed broad support for social risk screening. In these clinics, however, screening was not equitably distributed across the CHC population, likely secondary to clinic resource constraints. This raises the possibility that social risk screening initiatives in resource-poor settings—which are intended to be linked to offers of assistance—have the potential to worsen disparities if select patients are systematically not offered screening or subsequent services, for example, based on patients’ language or racial and cultural background. Lack of time and dedicated staff—symptoms of larger systemic issues around a traditional lack of investment in primary care and social services—emerged as the main forces driving barriers to screening and screening inequity.
Though some of the differences in screening rates by patient demographics are partially explained by differences in clinic population screening targets, interviews surfaced concerns that screening was more challenging and/or less often completed for patients with limited literacy and/or language barriers, even when CHCs noted having bilingual and culturally-concordant staff. We can hypothesize that this may be why Spanish-preferring patients may be screened at similar rates to their English-preferring peers, as CHCs noted having screening tools available in Spanish and English, though not other languages, which required use of an interpreter to screen if/when bilingual staff were not available. The PRAPARE tool is available in >25 languages, but only 2 of our study CHCs were using the PRAPARE tool. Availability of the screening tool itself in multiple languages may reduce some administration time, but may still require staff to use an interpreter to assist patients with the screening. The demographic differences in screening reach occurred irrespective of the general sense that screening was important and facilitated by high levels of community trust and engagement. The participating CHCs did not have the infrastructure in place to routinely review data on screening equity; they also were not being asked to report this type of data on social screening. The lack of internal and external accountability mechanisms increases the likelihood that screening inequities will go unnoticed and unaddressed. The Health Resources & Services Administration introduced updated Uniform Data System reporting requirements for health centers in 2019 that include the number of patients screened annually for social risks but there is no requirement to stratify by patient demographics—a missed opportunity to evaluate and enable future action on screening equity given CHCs are already separately reporting on demographic data.45,46
CHC resources will need to be dedicated to efforts to ensure that social risk screening and related interventions achieve their intended health equity impacts. This includes increasing the CHC workforce capacity around social care. Although our findings confirm that CHCs are deeply committed to providing high-quality, equitable care for the diverse populations that they serve, ensuring equity will require sufficient capacity so that those implementing screening can meaningfully engage with patients who need/want supports, including designing population-specific adaptations to screening. State Medicaid managed care programs, including those in Texas, allow for reimbursement for select social care-related activities.47,48 For instance, in Texas, CHCs can bill for quality improvement initiatives focused on social care49; in other states, CHW visits are billable, for example, through the Pathways Community Hub model.50 Other state programs have used Medicaid Section 1115 waivers to fund pilot interventions to screen for and address social needs.49,51⇓–53 These opportunities can help to scale and sustain what is otherwise often unfunded or grant-funded work, but they also may be inadequate reimbursement or incentive to overcome the many structural obstacles to adding social care workstreams into CHCs.
It will not be sufficient to increase staff diversity and capacity. In parallel, these staff will require training in screening workflows, documentation, and empathic inquiry/trust building. Although our study participants understood the reasons why screening was important, clinical workflows at participating CHCs had not been designed around screening and staff had limited/no training in how and when to conduct screening in ways that could increase patient acceptability and disclosure.30 Almost 30% of providers were not aware their CHC had adopted a standardized screening tool. Existing implementation training and resource guides targeted to CHC contexts might help to support clinics that are launching, strengthening, and/or scaling social care activities.54 Recommended trainings and related resources are available through PRAPARE, Centers for Medicare & Medicaid Services (CMS), Kaiser Permanente/OCHIN Inc, and the Oregon Primary Care Association.55⇓⇓⇓–59 These training/education efforts also require dedicated time and staffing.
CMS has indicated a growing commitment to expanding social care for Medicare and Medicaid beneficiaries60⇓–62 For example, the CMS Inpatient Quality Reporting Program launched new quality measures related to social risk screening in 202361 and is expected to endorse similar measures under the Merit Based Incentive Program in parallel.63 The National Committee for Quality Assurance also adopted new HEDIS measures in 2023 on social care, which tie screening to presence of an intervention.64 For many under-resourced health systems, these programs are unlikely to contribute to behavior change if not accompanied by infrastructure and capacity-building investments that can enable more equitable and patient-centered implementation. New social care-specific technology, including EHR-based standardized screening and related analytics programs,65,66 have the potential to distribute the burden of screening across more personnel, for example, if screening results are directly input into EHRs and designated staff are available to track screening results, the onus of screening will not fall entirely on frontline staff. Technology alone will not lower the barriers CHCs face to systematic screening; technology must be supported by staff training and quality improvement/analytics capacity that can help institutionalize screening uptake and effectiveness. Some care management software offer services that can help clinics access and track social risk-related data, but the added costs may be prohibitive for safety-net primary care clinics.67,68
Limitations
This study should be interpreted considering several limitations. This is a case study of 4 urban/suburban CHCs in Texas, which limits the generalizability of findings to other geographies/populations and non-CHC health care settings. Related, this was a convenience sample of participating CHCs and individual interview and survey participants; the study is subject to selection and social desirability bias. CHCs that participated were committed to continuing to screen. Individual staff and providers who participated may have had more favorable experiences with screening than their peers who declined. Across sites, however, participants shared many similar perspectives about the barriers to screening, which decreases the likelihood of positive response bias. Second, the study took place in the context of the COVID-19 pandemic and a natural disaster/state of emergency in Texas, all which caused major disruptions in the target CHCs. Our survey and interview sample sizes reflect these challenges. The original study plan included onsite observations and patient surveys, which we could not complete in the pandemic context. As a result of the study changes, this study does not represent patient perspectives on social risk screening. Finally, only 2 CHCs shared EHR data and datasets provided by those 2 sites did not include sufficient data to conduct comparative analyses of demographic trends in patients screened/not screened or positive social risk screens. Related, our EHR data analyses relied on social risk data documentation within structured data fields. It has been previously reported that structured data fields are underutilized and may underrepresent the true volume of screening at our study sites.69⇓–71
Conclusion
Across the 4 CHCs participating in this study, providers and staff strongly supported social risk screening in CHC contexts. Findings also highlight on-the-ground barriers to implementing and sustaining screening efforts, which without adequate staff capacity have the potential to exacerbate instead of reduce disparities. Overcoming resource barriers could improve screening reach, support sustainability, and advance equity but will require more targeted investments in the CHC workforce, dedicated social care training and education, and social care data analytics capacity to support quality improvement in this area.
Acknowledgments
We would like to thank the staff, leadership, and providers at the participating CHCs for their contributions to this study and moreover for their steadfast commitment to their patients. We also appreciate Nina Singh’s and Carlos Nguyen’s contributions to study coordination and data cleaning.
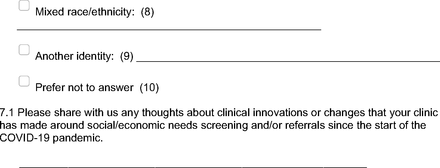
Appendices.Appendix 1. Provider/Staff Interview Guides and Provider Survey Tool

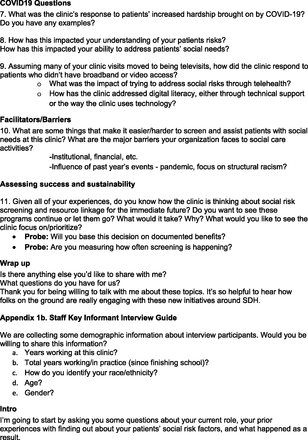
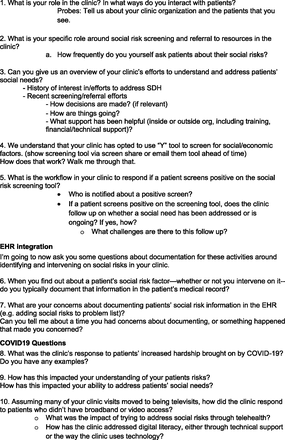
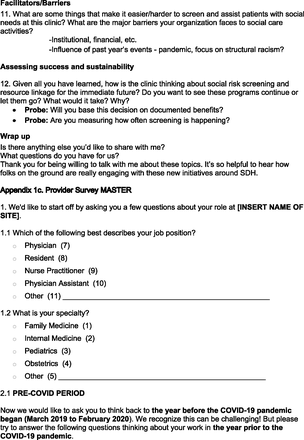

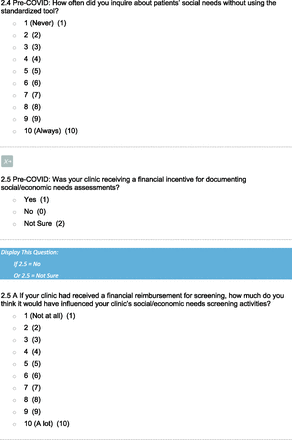

Appendix 2. Background on Study Site Screening Practices
Appendix 3. Survey Data Measures/Analyses
Notes
This article was externally peer reviewed.
This is the Ahead of Print version of the article.
Funding: This work was supported by a grant from the Episcopal Health Foundation. The views presented here are those of the authors and not necessarily those of EHF, its directors, officers, or staff. EHF had no role in study design and conduct of the study; collection, management, analysis, and interpretation of data; preparation, review, or approval of the manuscript; or decision to submit the manuscript for publication. EHD had full access to all the data in the study and takes responsibility for the integrity of the data and the accuracy of the data analysis. NR was funded through UCSF’s Institute for Health Policy Fellowship (AHRQ 5T32HS022241-08) during the data collection of this project and currently funded through the Clinical and Translational Science Center at the University of California, Davis (KL2R001859). BA was funded by NIH FIRST program under the National Cancer Institute (U54CA267789). MJ was employed by the National Association of Community Health Centers during data collection for this study.
Conflict of interest: None.
To see this article online, please go to: http://jabfm.org/content/00/00/000.full.
- Received for publication March 14, 2023.
- Revision received May 17, 2023.
- Accepted for publication May 22, 2023.


