
Article Figures & Data
Figures
- Figure 1.
Divisional variation from mean scope of practice score for early career and mid to late career family physicians.
- Figure 2.
Adjusted associations between scope of practice score and division controlling for clinician, practice, community, and health care market characteristics for early career and mid to late career family physicians.


Tables
- Table 1.
Divisional Variation of Clinician, Practice, Community, and Healthcare Market Characteristics of Early Career Family Physicians, 2017 to 2022
East North Central East South Central Middle Atlantic Mountain New England Pacific South Atlantic West North Central West South Central Full Population Scope of practice score
Mean (SD)15.99 (2.68) 15.53 (2.91) 15.22 (2.84) 17.10 (2.81) 16.05 (2.76) 16.23 (2.81) 15.40 (2.88) 17.51 (2.56) 15.43 (3.09) 16.04 (2.90) Domain 1: Clinician Age
Mean (SD)34.74 (4.07) 35.43 (4.67) 34.92 (4.26) 35.19 (3.86) 35.51 (4.43) 35.68 (3.95) 35.48 (4.76) 34.48 (3.97) 35.38 (4.63) 35.23 (4.30) Gender (percent) Woman 860 (54.0%) 258 (49.1%) 624 (58.3%) 506 (51.6%) 296 (64.9%) 1,353 (59.7%) 1,106 (55.7%) 606 (57.6%) 681 (52.3%) 6,290 (56.0%) Race (percent) American Indian or Alaska Native 8 (0.5%) 5 (1.0%) 4 (0.4%) 12 (1.2%) 2 (0.5%) 29 (1.3%) 14 (0.7%) 9 (0.9%) 18 (1.4%) 101 (0.9%) Asian 298 (19.3%) 70 (13.6%) 317 (30.0%) 132 (13.7%) 72 (16.6%) 700 (31.5%) 327 (16.7%) 105 (10.1%) 295 (23.2%) 2,316 (21.1%) Black or African American 92 (5.9%) 50 (9.7%) 82 (7.8%) 17 (1.8%) 25 (5.8%) 90 (4.1%) 288 (14.7%) 32 (3.1%) 120 (9.4%) 796 (7.2%) Native Hawaiian or Pacific Islander 6 (0.4%) 0 (0%) 1 (0.1%) 4 (0.4%) 2 (0.5%) 22 (1.0%) 10 (0.5%) 1 (0.1%) 6 (0.5%) 52 (0.5%) White 1,110 (71.7%) 381 (74.0%) 610 (57.7%) 771 (80.1%) 320 (73.9%) 1,264 (56.9%) 1,265 (64.8%) 875 (84.5%) 800 (62.9%) 7,396 (67.3%) Other 34 (2.2%) 9 (1.7%) 43 (4.1%) 27 (2.8%) 12 (2.8%) 116 (5.2%) 49 (2.5%) 14 (1.4%) 32 (2.5%) 336 (3.1%) Ethnicity (percent) Hispanic or Latino 60 (3.9%) 14 (2.7%) 69 (6.5%) 84 (8.7%) 17 (3.9%) 272 (12.2%) 213 (10.9%) 31 (3.0%) 201 (15.8%) 961 (8.7%) International medical graduate status (percent) International medical graduate 507 (31.8%) 149 (28.4%) 448 (41.8%) 194 (19.8%) 127 (27.9%) 622 (27.4%) 726 (36.6%) 181 (17.2%) 480 (36.9%) 3,434 (30.6%) Degree type, MD versus DO (percent) DO degree 323 (20.3%) 109 (20.8%) 220 (20.5%) 221 (22.5%) 73 (16.0%) 486 (21.4%) 330 (16.6%) 277 (26.3%) 205 (15.7%) 2,244 (20.0%) Residency location (percent) Small rural 1 (0.1%) 12 (2.4%) 2 (0.2%) 0 (0%) 1 (0.2%) 4 (0.2%) 2 (0.1%) 0 (0%) 11 (1.0%) 33 (0.3%) Large rural 65 (4.4%) 55 (11.0%) 21 (2.0%) 22 (2.4%) 30 (6.7%) 64 (3.0%) 80 (4.4%) 48 (4.8%) 38 (3.3%) 423 (4.0%) Urban 1,419 (95.6%) 431 (86.5%) 1,020 (97.8%) 879 (97.6%) 416 (93.1%) 2,097 (96.9%) 1,755 (95.5%) 952 (95.2%) 1,099 (95.7%) 10,068 (95.7%) Domain 2: Practice Practice type (percent) Academic health center 230 (16.7%) 42 (10.1%) 148 (17.1%) 88 (10.4%) 57 (14.5%) 182 (9.1%) 207 (13.1%) 91 (9.9%) 128 (12.4%) 1,173 (12.4%) Federally qualified health center 130 (9.4%) 43 (10.3%) 120 (13.8%) 144 (17.0%) 96 (24.5%) 373 (18.7%) 151 (9.6%) 45 (4.9%) 73 (7.0%) 1,175 (12.5%) Federal military 14 (1.0%) 29 (7.0%) 16 (1.8%) 51 (6.0%) 7 (1.8%) 108 (5.4%) 155 (9.8%) 23 (2.5%) 57 (5.5%) 460 (4.9%) Rural health center 50 (3.6%) 28 (6.7%) 10 (1.2%) 54 (6.4%) 5 (1.3%) 73 (3.7%) 37 (2.3%) 120 (13.0%) 60 (5.8%) 437 (4.6%) Independently owned 133 (9.7%) 83 (19.9%) 128 (14.7%) 119 (14.0%) 36 (9.2%) 192 (9.6%) 243 (15.4%) 104 (11.3%) 193 (18.6%) 1,231 (13.1%) Managed care/HMO 32 (2.3%) 8 (1.9%) 15 (1.7%) 50 (5.9%) 12 (3.1%) 364 (18.2%) 128 (8.1%) 10 (1.1%) 39 (3.8%) 658 (7.0%) Hospital/Health system 732 (53.2%) 163 (39.1%) 394 (45.4%) 277 (32.7%) 165 (42.1%) 524 (26.2%) 570 (36.2%) 482 (52.3%) 408 (39.4%) 3,715 (39.4%) Other 56 (4.1%) 21 (5.0%) 37 (4.3%) 65 (7.7%) 14 (3.6%) 181 (9.1%) 85 (5.4%) 46 (5.0%) 78 (7.5%) 583 (6.2%) Principal practice ownership (percent) Not owner 1,042 (92.5%) 240 (81.1%) 636 (92.8%) 459 (86.0%) 258 (95.6%) 962 (76.2%) 1,000 (87.1%) 608 (88.5%) 671 (87.4%) 5,876 (86.7%) Owner 85 (7.5%) 56 (18.9%) 49 (7.2%) 75 (14.0%) 12 (4.4%) 300 (23.8%) 148 (12.9%) 79 (11.5%) 97 (12.6%) 901 (13.3%) Practice size (percent) Group 1,335 (96.9%) 393 (94.2%) 834 (96.1%) 830 (97.9%) 387 (98.7%) 1,964 (98.3%) 1,518 (96.3%) 906 (98.4%) 978 (94.4%) 9,145 (97.0%) Solo 42 (3.1%) 24 (5.8%) 34 (3.9%) 18 (2.1%) 5 (1.3%) 33 (1.7%) 58 (3.7%) 15 (1.6%) 58 (5.6%) 287 (3.0%) Practice specialty mix (percent) Family medicine only 690 (50.1%) 197 (47.2%) 411 (47.4%) 378 (44.6%) 159 (40.6%) 566 (28.3%) 741 (47.0%) 475 (51.6%) 434 (41.9%) 4,051 (42.9%) Multiple specialties (Not only primary care) 321 (23.3%) 88 (21.1%) 195 (22.5%) 182 (21.5%) 81 (20.7%) 577 (28.9%) 316 (20.1%) 219 (23.8%) 266 (25.7%) 2,245 (23.8%) Primary care specialty mix 366 (26.6%) 132 (31.7%) 262 (30.2%) 288 (34.0%) 152 (38.8%) 854 (42.8%) 519 (32.9%) 227 (24.6%) 337 (32.5%) 3,137 (33.3%) Domain 3: Community Social deprivation index (SD) 46.13 (28.70) 56.67 (22.49) 43.16 (30.91) 47.76 (26.57) 35.46 (27.24) 60.48 (24.61) 52.60 (26.94) 27.73 (21.56) 59.51 (24.74) 49.91 (28.04) Rurality (percent) Isolated 25 (1.6%) 16 (3.1%) 13 (1.2%) 33 (3.4%) 15 (3.3%) 29 (1.3%) 24 (1.2%) 77 (7.3%) 11 (0.8%) 243 (2.2%) Small rural 142 (9.0%) 77 (14.8%) 57 (5.3%) 97 (9.9%) 39 (8.6%) 144 (6.4%) 124 (6.3%) 187 (17.8%) 118 (9.1%) 985 (8.8%) Large rural 93 (5.9%) 59 (11.3%) 16 (1.5%) 87 (8.9%) 31 (6.8%) 83 (3.7%) 43 (2.2%) 160 (15.2%) 80 (6.2%) 652 (5.8%) Urban 1,323 (83.6%) 370 (70.9%) 980 (91.9%) 758 (77.7%) 370 (81.3%) 2,003 (88.7%) 1,790 (90.4%) 626 (59.6%) 1,090 (83.9%) 9,310 (83.2%) Premature death rate (percent) High 22 (1.4%) 129 (24.9%) 2 (0.2%) 52 (5.3%) 0 (0%) 9 (0.4%) 204 (10.3%) 27 (2.6%) 96 (7.4%) 541 (4.8%) Medium 787 (49.6%) 348 (67.1%) 469 (44.0%) 234 (24.0%) 96 (21.1%) 219 (9.7%) 785 (39.6%) 454 (43.2%) 488 (37.5%) 3,880 (34.7%) Low 778 (49.0%) 42 (8.1%) 595 (55.8%) 690 (70.7%) 360 (78.9%) 2,028 (89.9%) 991 (50.1%) 570 (54.2%) 716 (55.1%) 6,770 (60.5%) Domain 4: Healthcare market Beds per hospital (percent) High 1,128 (71.1%) 332 (64.0%) 919 (86.2%) 618 (63.3%) 353 (77.4%) 1,859 (82.3%) 1,550 (78.3%) 517 (49.2%) 881 (67.8%) 8,157 (72.9%) Medium 387 (24.4%) 159 (30.6%) 123 (11.5%) 298 (30.5%) 99 (21.7%) 361 (16.0%) 336 (17.0%) 392 (37.3%) 323 (24.8%) 2,478 (22.1%) Low 72 (4.5%) 28 (5.4%) 24 (2.3%) 60 (6.1%) 4 (0.9%) 39 (1.7%) 94 (4.7%) 142 (13.5%) 96 (7.4%) 559 (5.0%) Medicare cost per capita (percent) High 461 (29.0%) 113 (21.8%) 507 (47.6%) 83 (8.5%) 246 (53.9%) 1,305 (57.8%) 664 (33.5%) 164 (15.6%) 748 (57.5%) 4,291 (38.3%) Medium 864 (54.4%) 357 (68.8%) 443 (41.6%) 459 (47.0%) 130 (28.5%) 448 (19.8%) 1,098 (55.5%) 619 (58.9%) 521 (40.1%) 4,939 (44.1%) Low 262 (16.5%) 49 (9.4%) 116 (10.9%) 434 (44.5%) 80 (17.5%) 506 (22.4%) 218 (11.0%) 268 (25.5%) 31 (2.4%) 1,964 (17.5%) External reasons for not practicing OB or inpatient medicine (percent) No 1,204 (75.6%) 368 (70.1%) 712 (66.5%) 684 (69.7%) 311 (68.2%) 1,546 (68.2%) 1,265 (63.7%) 790 (75.1%) 893 (68.6%) 7,773 (69.2%) Yes 388 (24.4%) 157 (29.9%) 359 (33.5%) 297 (30.3%) 145 (31.8%) 720 (31.8%) 721 (36.3%) 262 (24.9%) 409 (31.4%) 3,458 (30.8%) Ratio of primary care physicians High 50 (3.2%) 47 (9.1%) 0 (0%) 43 (4.4%) 0 (0%) 34 (1.5%) 39 (2.0%) 162 (15.4%) 69 (5.3%) 444 (4.0%) Medium 517 (32.6%) 212 (40.8%) 242 (22.7%) 326 (33.4%) 120 (26.3%) 743 (32.9%) 595 (30.1%) 492 (46.8%) 559 (43.0%) 3,806 (34.0%) Low 1,020 (64.3%) 260 (50.1%) 824 (77.3%) 607 (62.2%) 336 (73.7%) 1,482 (65.6%) 1,346 (68.0%) 397 (37.8%) 672 (51.7%) 6,944 (62.0%) *External reasons for not practicing OB and Internal Medicine includes selecting either “challenges with privileging” or “not available in the practice I joined”, as reasons for not practicing either inpatient medicine or obstetric care.
±All tests have P-values of < 0.0001.
Abbreviation: SD, Standard deviation.
- Table 2.
Divisional Variation of Clinician, Practice, Community, and Healthcare Market Characteristics of Mid to Late Career Family Physicians, 2017 to 2022
East North Central East South Central Middle Atlantic Mountain New England Pacific South Atlantic West North Central West South Central Full Population Scope of practice score
Mean (SD)13.68 (3.51) 12.63 (3.81) 12.59 (3.54) 13.42 (3.86) 13.20 (3.44) 12.26 (3.75) 11.49 (3.62) 14.95 (3.98) 12.20 (3.82) 12.77 (3.83) Domain 1: Clinician Age
Mean (SD)50.08 (9.39) 50.37 (9.65) 50.54 (9.72) 50.04 (8.94) 51.04 (9.45) 49.45 (9.06) 50.56 (9.39) 50.22 (9.29) 49.46 (9.09) 50.09 (9.31) Gender (percent) Female 2,588 (45.2%) 711 (37.1%) 1,683 (48.5%) 1,251 (42.2%) 832 (52.5%) 3,464 (50.5%) 3,002 (44.1%) 1,432 (43.0%) 1596 (38.8%) 16,559 (45.0%) Race (percent) American Indian or Alaska Native 31 (0.5%) 12 (0.6%) 12 (0.3%) 44 (1.5%) 8 (0.5%) 62 (0.9%) 48 (0.7%) 35 (1.1%) 59 (1.4%) 311 (0.8%) Asian 881 (15.4%) 179 (9.3%) 657 (19.0%) 277 (9.3%) 201 (12.7%) 1,867 (27.2%) 1,028 (15.1%) 261 (7.8%) 775 (18.8%) 6,126 (16.7%) Black or African American 277 (4.8%) 188 (9.8%) 225 (6.5%) 66 (2.2%) 51 (3.2%) 223 (3.3%) 854 (12.6%) 93 (2.8%) 320 (7.8%) 2,297 (6.2%) Native Hawaiian or Pacific Islander 20 (0.3%) 1 (0.1%) 12 (0.3%) 17 (0.6%) 5 (0.3%) 85 (1.2%) 28 (0.4%) 9 (0.3%) 17 (0.4%) 194 (0.5%) White 4,222 (73.7%) 1,464 (76.4%) 2,347 (67.7%) 2,388 (80.5%) 1,254 (79.1%) 3,943 (57.5%) 4,423 (65.0%) 2,823 (84.8%) 2,696 (65.5%) 25,560 (69.5%) Other 298 (5.2%) 71 (3.7%) 214 (6.2%) 174 (5.9%) 66 (4.2%) 673 (9.8%) 419 (6.2%) 109 (3.3%) 248 (6.0%) 2,272 (6.2%) Ethnicity (percent) Hispanic or Latino 239 (4.2%) 39 (2.0%) 180 (5.2%) 232 (7.8%) 61 (3.8%) 641 (9.4%) 642 (9.4%) 92 (2.8%) 542 (13.2%) 2,668 (7.3%) International medical graduate status (percent) International medical graduate 1,367 (24.2%) 331 (17.4%) 1,056 (31.1%) 439 (14.9%) 303 (19.3%) 1,721 (25.4%) 1,926 (28.7%) 401 (12.1%) 1,112 (27.3%) 8,656 (23.8%) Degree type, MD versus DO (percent) DO degree 610 (10.6%) 188 (9.8%) 480 (13.8%) 447 (15.1%) 191 (12.1%) 740 (10.8%) 559 (8.2%) 466 (14.0%) 412 (10.0%) 4,093 (11.1%) Residency location (percent) Small rural 2 (0.0%) 27 (1.5%) 3 (0.1%) 1 (0.0%) 0 (0%) 1 (0.0%) 8 (0.1%) 0 (0%) 8 (0.2%) 50 (0.2%) Large rural 161 (3.1%) 175 (9.8%) 51 (1.6%) 78 (3.0%) 110 (7.4%) 123 (1.9%) 219 (3.6%) 153 (5.2%) 105 (3.0%) 1,175 (3.5%) Urban 5,026 (96.9%) 1,580 (88.7%) 3,191 (98.3%) 2,524 (97.0%) 1,368 (92.6%) 6,202 (98.0%) 5,839 (96.3%) 2,803 (94.8%) 3,382 (96.7%) 31,915 (96.3%) Domain 2: Practice Practice type (percent) Academic health center 426 (8.7%) 106 (7.0%) 292 (9.7%) 186 (7.3%) 101 (7.4%) 351 (5.9%) 405 (7.1%) 226 (8.2%) 280 (8.3%) 2,373 (7.6%) Federally qualified health center 254 (5.2%) 64 (4.2%) 211 (7.0%) 221 (8.7%) 201 (14.6%) 590 (9.8%) 271 (4.8%) 91 (3.3%) 124 (3.7%) 2,027 (6.5%) Federal military 86 (1.8%) 83 (5.5%) 69 (2.3%) 112 (4.4%) 24 (1.7%) 223 (3.7%) 411 (7.2%) 83 (3.0%) 174 (5.2%) 1,265 (4.1%) Rural health center 123 (2.5%) 57 (3.8%) 19 (0.6%) 82 (3.2%) 28 (2.0%) 101 (1.7%) 61 (1.1%) 148 (5.4%) 97 (2.9%) 716 (2.3%) Independently owned 1,231 (25.2%) 596 (39.4%) 993 (32.8%) 829 (32.6%) 329 (23.9%) 1,418 (23.7%) 1,987 (35.0%) 606 (22.0%) 1,295 (38.4%) 9,284 (29.8%) Managed care/HMO 83 (1.7%) 8 (0.5%) 23 (0.8%) 139 (5.5%) 14 (1.0%) 1,239 (20.7%) 278 (4.9%) 64 (2.3%) 81 (2.4%) 1,929 (6.2%) Hospital/Health system 2,354 (48.2%) 470 (31.1%) 1,189 (39.3%) 699 (27.5%) 582 (42.4%) 1,363 (22.7%) 1,734 (30.5%) 1,369 (49.6%) 964 (28.6%) 10,724 (34.4%) Other 324 (6.6%) 128 (8.5%) 228 (7.5%) 276 (10.8%) 95 (6.9%) 710 (11.8%) 529 (9.3%) 172 (6.2%) 356 (10.6%) 2,818 (9.1%) Principal practice ownership (percent) Not owner 3,807 (78.0%) 970 (64.2%) 2,249 (74.4%) 1,809 (71.1%) 1,113 (81.0%) 3,766 (62.8%) 4,064 (71.6%) 2,202 (79.8%) 2,266 (67.2%) 22,246 (71.4%) Owner 1,074 (22.0%) 542 (35.8%) 775 (25.6%) 735 (28.9%) 261 (19.0%) 2,229 (37.2%) 1,612 (28.4%) 557 (20.2%) 1,105 (32.8%) 8,890 (28.6%) Practice size (percent) Group 4,369 (89.5%) 1,296 (85.7%) 2,601 (86.0%) 2,341 (92.0%) 1,263 (91.9%) 5,480 (91.4%) 4,923 (86.7%) 2,614 (94.7%) 2,804 (83.2%) 27,691 (88.9%) Solo 512 (10.5%) 216 (14.3%) 423 (14.0%) 203 (8.0%) 111 (8.1%) 515 (8.6%) 753 (13.3%) 145 (5.3%) 567 (16.8%) 3,445 (11.1%) Practice specialty mix (percent) Family medicine only 2,488 (54.3%) 790 (55.9%) 1,590 (56.8%) 1,162 (49.4%) 621 (49.7%) 1,914 (34.6%) 2,774 (53.1%) 1,344 (52.1%) 1,623 (51.5%) 14,306 (49.5%) Multiple specialties (Not only primary care) 958 (20.9%) 245 (17.3%) 486 (17.4%) 505 (21.5%) 222 (17.8%) 1,728 (31.2%) 931 (17.8%) 690 (26.7%) 643 (20.4%) 6,408 (22.2%) Primary care specialty mix 1,136 (24.8%) 379 (26.8%) 721 (25.8%) 684 (29.1%) 406 (32.5%) 1,888 (34.1%) 1,522 (29.1%) 546 (21.2%) 883 (28.0%) 8,165 (28.3%) Health care professional collaboration in practice Physician assistant 2,183 (38.1%) 629 (32.8%) 1,575 (45.4%) 1,769 (59.6%) 786 (49.6%) 3,645 (53.2%) 3,139 (46.2%) 1,907 (57.3%) 1,588 (38.6%) 17,221 (46.8%) Domain 3: Community Social deprivation index (SD) 41.88 (28.14) 53.47 (22.74) 38.71 (29.35) 44.58 (26.76) 31.01 (24.59) 58.82 (24.23) 49.09 (27.09) 27.51 (20.89) 59.81 (25.15) 47.11 (27.83) Rurality (percent) Isolated 147 (2.6%) 52 (2.7%) 49 (1.4%) 91 (3.1%) 100 (6.3%) 73 (1.1%) 88 (1.3%) 180 (5.4%) 47 (1.1%) 827 (2.3%) Small rural 414 (7.2%) 180 (9.4%) 89 (2.6%) 193 (6.5%) 103 (6.5%) 152 (2.2%) 162 (2.4%) 396 (11.9%) 210 (5.1%) 1,899 (5.2%) Large rural 567 (9.9%) 317 (16.6%) 192 (5.5%) 295 (10.0%) 147 (9.3%) 337 (4.9%) 424 (6.2%) 518 (15.6%) 313 (7.6%) 3,110 (8.5%) Urban 4,591 (80.3%) 1,364 (71.3%) 3,130 (90.5%) 2,381 (80.4%) 1,231 (77.9%) 6,280 (91.8%) 6,111 (90.1%) 2,228 (67.1%) 3,536 (86.1%) 30,852 (84.1%) Premature death rate (percent) High 138 (2.5%) 479 (26.2%) 18 (0.5%) 117 (4.0%) 10 (0.6%) 37 (0.6%) 649 (9.9%) 89 (2.7%) 315 (7.9%) 1,852 (5.2%) Medium 2,805 (49.9%) 1,145 (62.6%) 1,353 (40.5%) 631 (21.8%) 385 (25.0%) 515 (7.7%) 2,627 (40.0%) 1,174 (35.9%) 1,368 (34.3%) 12,003 (33.6%) Low 2,676 (47.6%) 206 (11.3%) 1,968 (58.9%) 2,151 (74.2%) 1,146 (74.4%) 6,139 (91.8%) 3,288 (50.1%) 2,005 (61.4%) 2,309 (57.8%) 21,888 (61.2%) Domain 4: Healthcare market Beds per hospital (percent) High 3,651 (65.0%) 1,175 (64.2%) 2,819 (84.4%) 1,891 (65.2%) 1,035 (67.2%) 5,571 (83.2%) 5,073 (77.3%) 1,766 (54.0%) 2,834 (71.0%) 25,815 (72.2%) Medium 1,670 (29.7%) 555 (30.3%) 435 (13.0%) 874 (30.1%) 487 (31.6%) 1,035 (15.5%) 1,138 (17.3%) 1,152 (35.3%) 932 (23.3%) 8,278 (23.2%) Low 298 (5.3%) 100 (5.5%) 85 (2.5%) 134 (4.6%) 19 (1.2%) 88 (1.3%) 353 (5.4%) 350 (10.7%) 226 (5.7%) 1,653 (4.6%) Medicare cost per capita (percent) High 1,440 (25.6%) 316 (17.3%) 1,438 (43.1%) 220 (7.6%) 756 (49.1%) 3,847 (57.5%) 2,000 (30.5%) 365 (11.2%) 2,443 (61.2%) 12,825 (35.9%) Medium 3,173 (56.5%) 1,280 (69.9%) 1,540 (46.1%) 1,339 (46.2%) 449 (29.1%) 1,430 (21.4%) 3,797 (57.8%) 2,074 (63.5%) 1,468 (36.8%) 16,550 (46.3%) Low 1,006 (17.9%) 234 (12.8%) 361 (10.8%) 1,340 (46.2%) 336 (21.8%) 1,417 (21.2%) 767 (11.7%) 829 (25.4%) 81 (2.0%) 6,371 (17.8%) External reasons for not practicing OB or Inpatient Medicine (percent) No 3,906 (68.2%) 1,290 (67.4%) 2,158 (62.2%) 1,870 (63.0%) 952 (60.1%) 4,136 (60.4%) 4,121 (60.6%) 2,292 (68.8%) 2,720 (66.1%) 23,445 (63.8%) Yes 1,823 (31.8%) 625 (32.6%) 1,310 (37.8%) 1,096 (37.0%) 633 (39.9%) 2,717 (39.6%) 2,679 (39.4%) 1,039 (31.2%) 1,396 (33.9%) 13,318 (36.2%) *All tests have P-values of < 0.0001.
Abbreviation: SD, Standard deviation.
- Table 3.
Scope of Practice Score by Clinician, Practice, Community, and Healthcare Market Characteristics for Early Career (NGS) and Mid to Late Career (CCQ) Family Physicians, 2017 to 2022
Scope of Practice Score NGS CCQ Mean (SD) Mean (SD) Clinician Gender Female 15.79 (2.87) 12.56 (3.76) Male 15.86 (2.76) 13.04 (3.87) Race American Indian or Alaska Native 15.85 (2.43) 13.15 (3.67) Asian 14.88 (2.86) 11.28 (3.43) Black or African American 15.01 (2.81) 11.47 (3.62) Native Hawaiian or other Pacific Islander 16.32 (2.57) 11.87 (3.42) Other 15.25 (2.86) 13.38 (3.79) White 16.20 (2.73) 11.94 (3.80) Ethnicity Hispanic or Latino 15.25 (3.24) 11.40 (3.77) Not Hispanic or Latino 15.87 (2.78) 12.93 (3.81) International medical graduates US medical graduate 16.12 (2.70) 13.29 (3.79) International medical graduate 15.07 (2.98) 11.29 (3.53) Degree type DO 15.96 (2.56) 13.00 (3.82) MD 15.79 (2.89) 12.79 (3.82) Residency location Small rural residency 16.09 (3.00) 12.71 (4.57) Large rural residency 14.33 (4.39) 13.59 (4.29) Urban residency 15.82 (2.81) 12.79 (3.80) Practice Practice type Academic health center 17.67 (2.76) 15.52 (4.05) FQHC ̂ 13.31 (3.52) Federal military ̂ 8.86 (3.80) Hospital/health system 15.52 (2.64) 13.11 (3.39) Independently owned Medical practice 15.59 (2.82) 12.85 (3.48) Managed care/HMO 14.81 (2.66) 10.52 (3.35) RHC ̂ 16.22 (3.75) Other practice type ̂ 10.67 (3.86) Practice ownership Owns practice 15.16 (2.93) 12.78 (3.94) Does not own practice 15.85 (2.82) 12.91 (3.53) Practice size Group practice 15.85 (2.82) 12.87 (3.85) Solo practice 15.16 (2.93) 12.38 (3.54) Practice specialties Family medicine only 16.36 (2.76) 13.49 (3.74) Multiple specialties (not just primary care) 15.30 (2.87) 12.18 (3.85) Primary care specialty mix 15.38 (2.73) 12.13 (3.74) Collaboration Collaborates with PA # 13.12 (3.87) Does not collaborate with PA # 12.58 (3.77) Community Rurality Isolated 18.00 (2.26) 16.08 (3.66) Small rural 16.83 (2.54) 16.15 (3.88) Large rural 18.02 (2.53) 14.38 (3.88) Urban 15.58 (2.79) 12.36 (3.62) Premature death rate High premature death 16.10 (2.25) 16.08 (3.66) Medium premature death 16.04 (2.79) 16.15 (3.88) Low premature death 15.69 (2.87) 14.38 (3.88) Healthcare market Beds per hospital Beds per hospital - High 15.58 (2.81) 12.22 (3.66) Beds per hospital - Medium 16.48 (2.75) 14.27 (3.83) Beds per hospital - Low 16.92 (2.77) 14.82 (3.74) Medicare cost per capita Medicare cost per capita - High 15.24 (2.91) 11.85 (3.80) Medicare cost per capita - Medium 15.92 (2.69) 13.06 (3.70) Medicare cost per capita - Low 16.78 (2.70) 14.19 (3.69) Reasons for not practicing OB or Inpatient Medicine Yes 15.49 (2.46) 13.26 (3.97) No 15.96 (2.95) 12.05 (3.42) Ratio of primary care physicians High 18.5 (2.7) 16.7 (3.9) Medium 16.4 (2.9) 13.5 (3.7) Low 15.7 (2.9) 12.2(3.7) *Scope score ranges from 0–30.
̂Sample sizes were too small to produce a reliable regression model.
#Data not available in NGS.
NGS is National Graduate Survey. CCQ is Continuous Certification Questionnaire.
Abbreviations: SD, Service delivery; MD, Doctor of Medicine; DO, Doctor of Osteopathic Medicine; FQHC, Federally qualified health center; HMO, Health maintenance organization; RHC, Rural health clinic; OB, Obstetrics; PA, Physician assistant.
In this issue


Jump to section
- Article
- Abstract
- Introduction
- Methods
- Results
- Discussion
- Conclusion
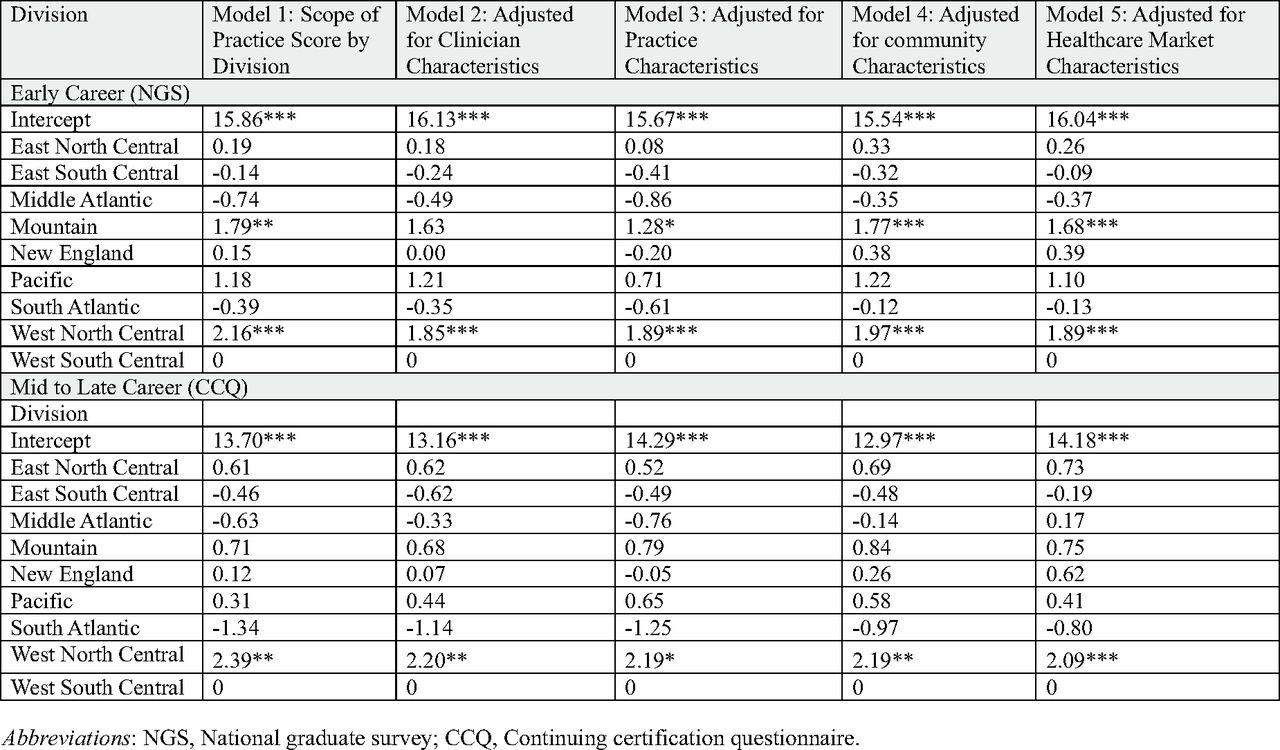
- Appendix Table 1. Adjusted Associations Between Scope of Practice Score and Division Controlling for Clinician, Practice, Community, and Healthcare Market Characteristics for Early Career and Mid to Late Career Family Physicians
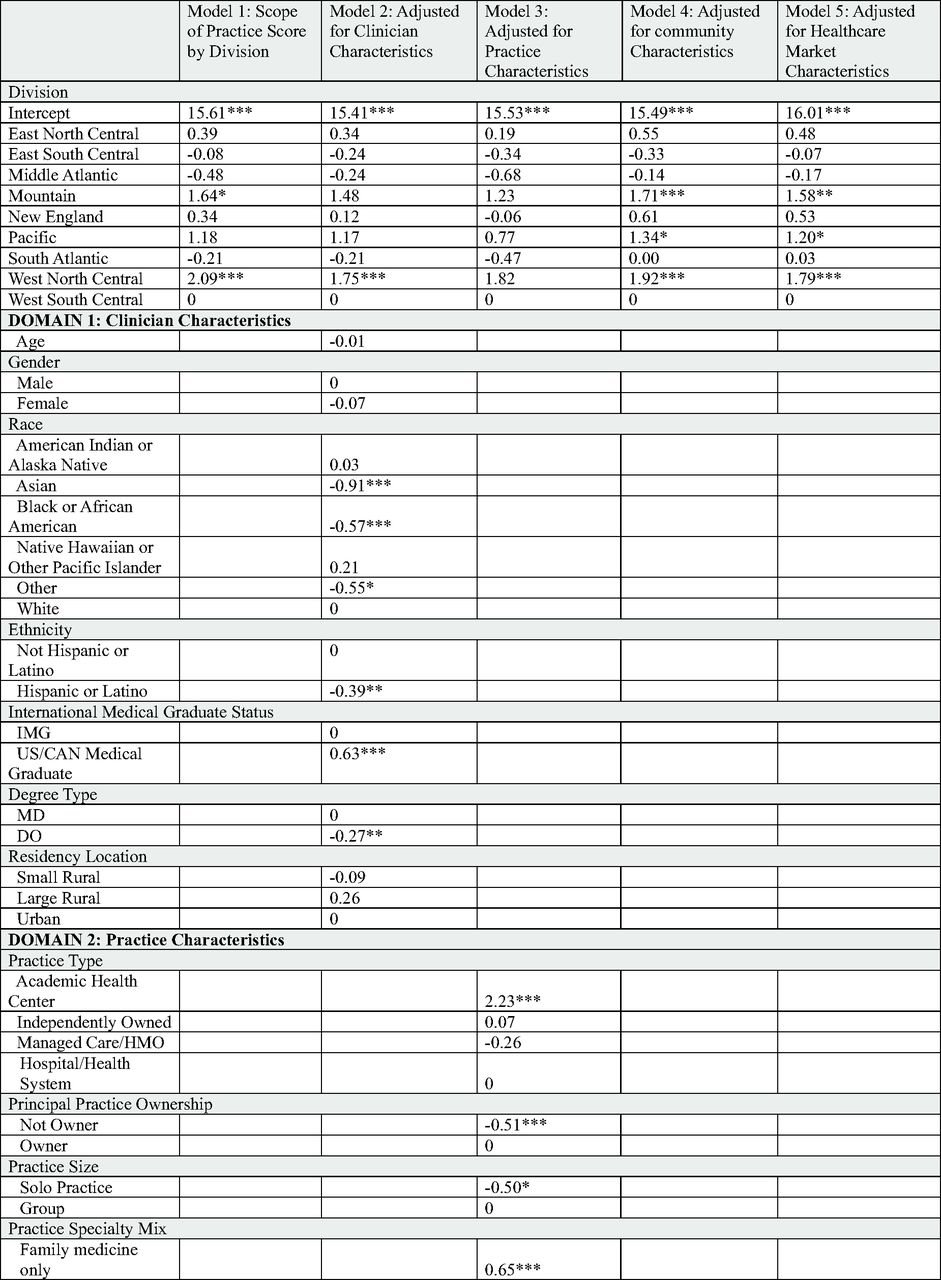
- Appendix Table 2. Adjusted Associations Between Scope of Practice Score and Division Controlling for Clinician, Practice, Community, and Healthcare Market Characteristics for Early Career Family Physicians
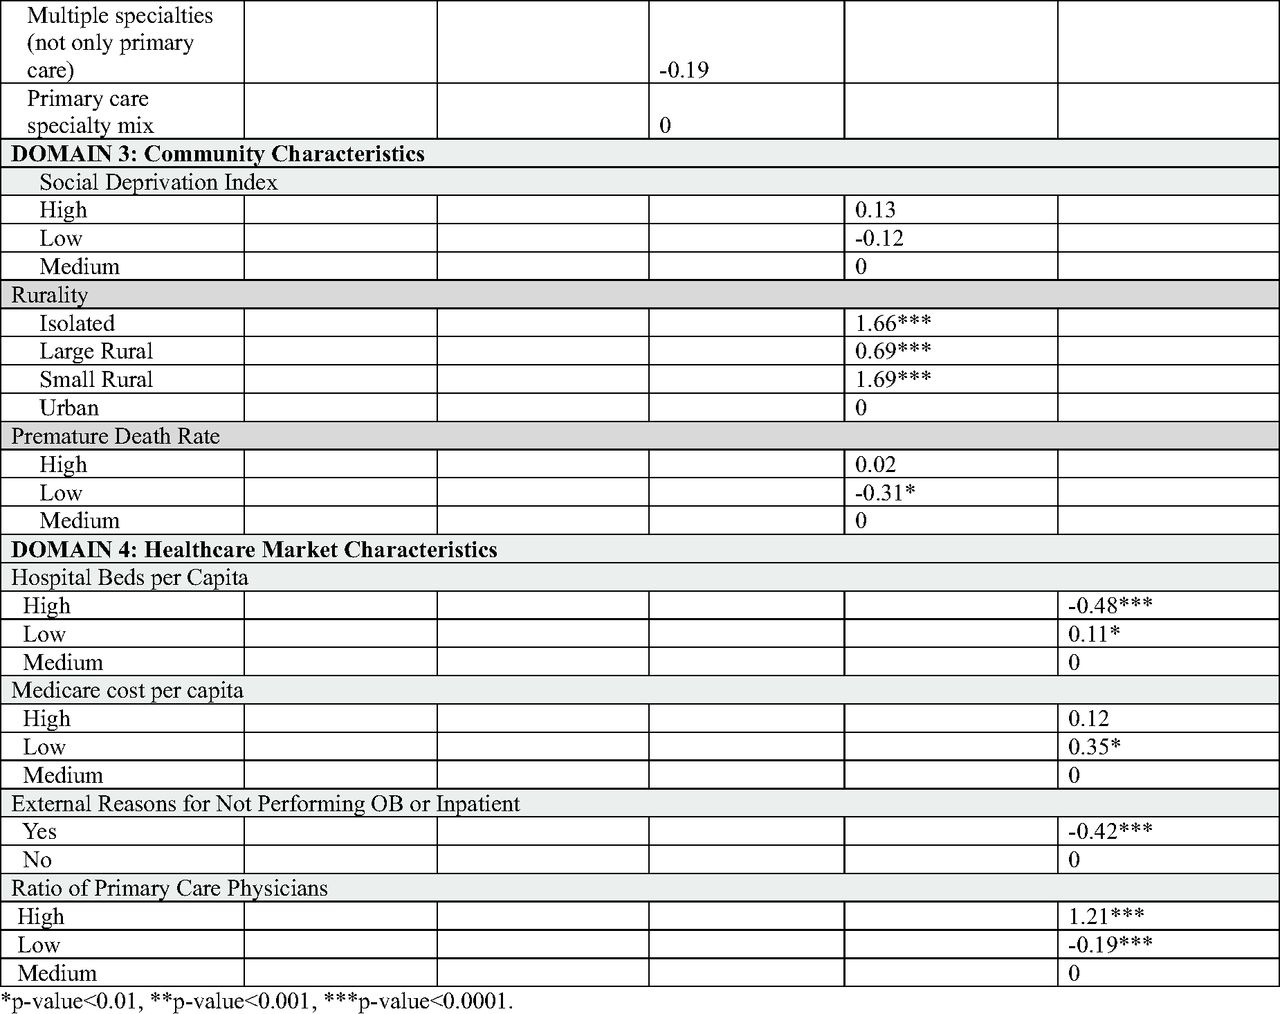
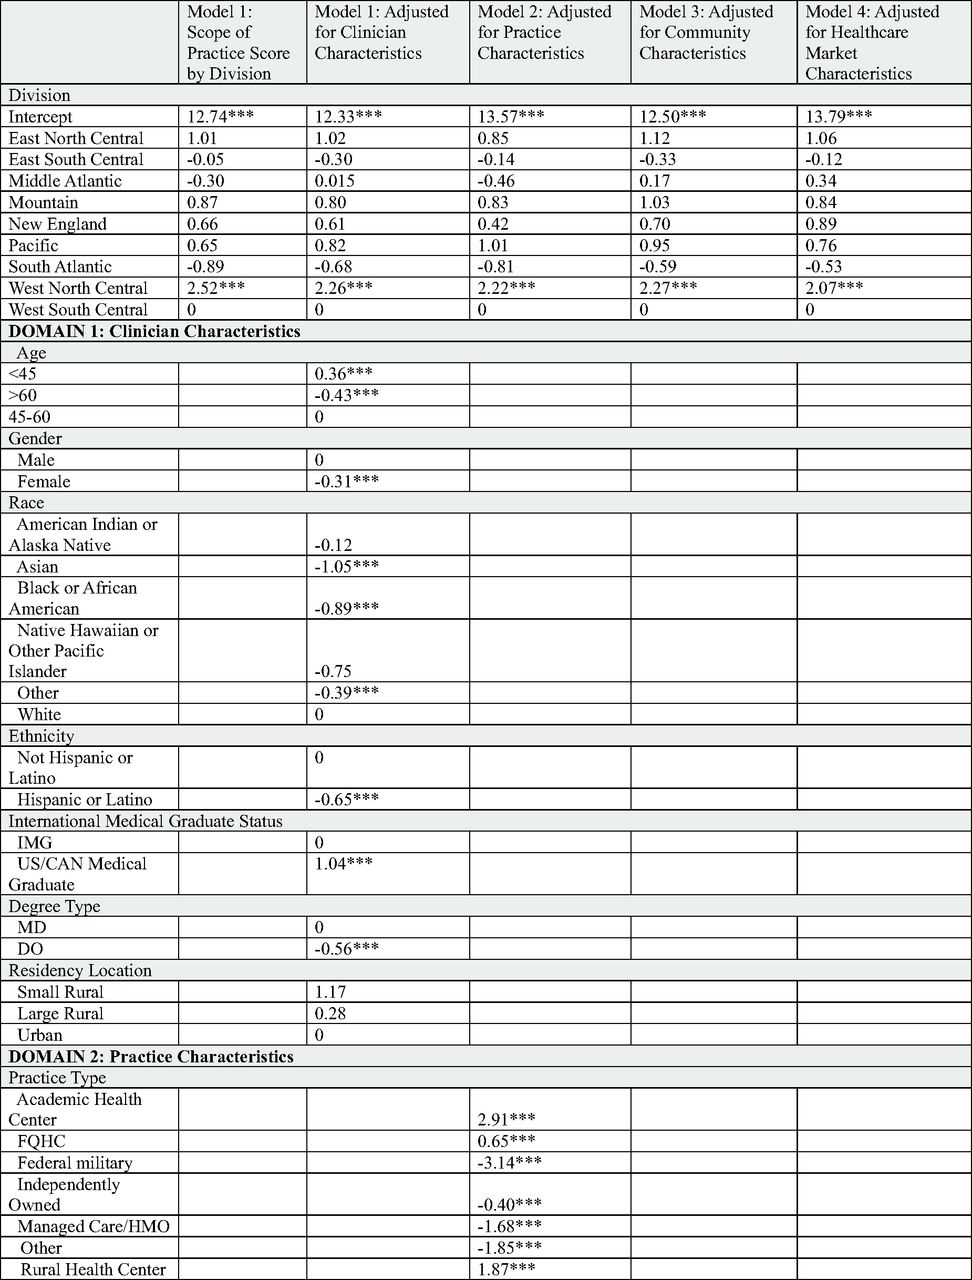
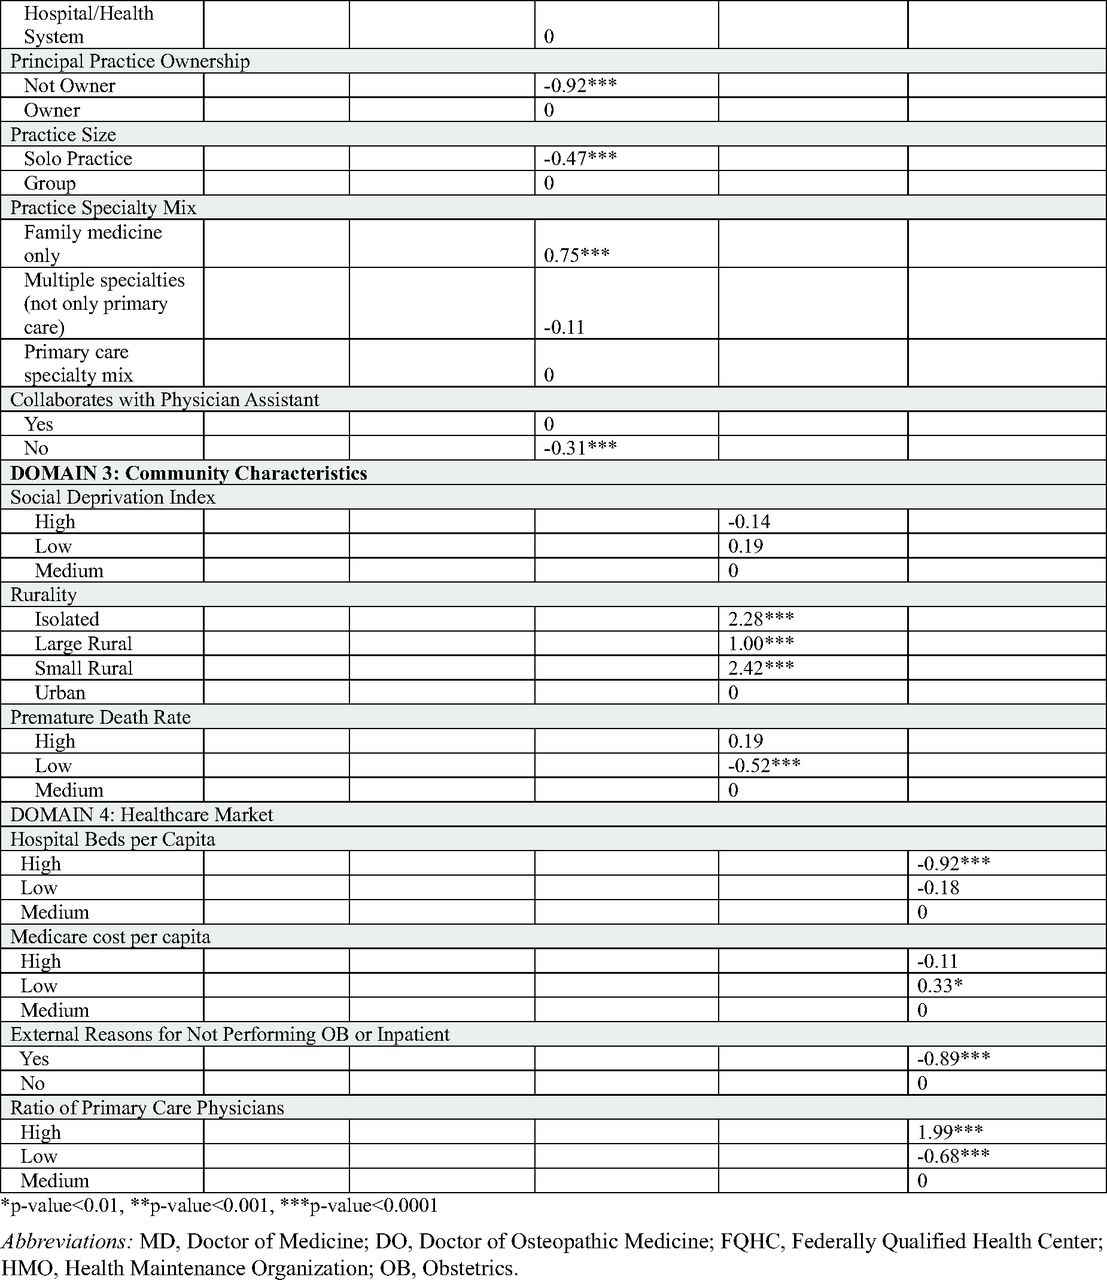
- Appendix Table 3. Adjusted Associations Between Scope of Practice Score and Division Controlling for Clinician, Practice, Community, and Healthcare Market Characteristics for Mid to Late Career Family Physicians
- Notes
- References
- Figures & Data
- References
- Info & Metrics