
Article Figures & Data
Figures
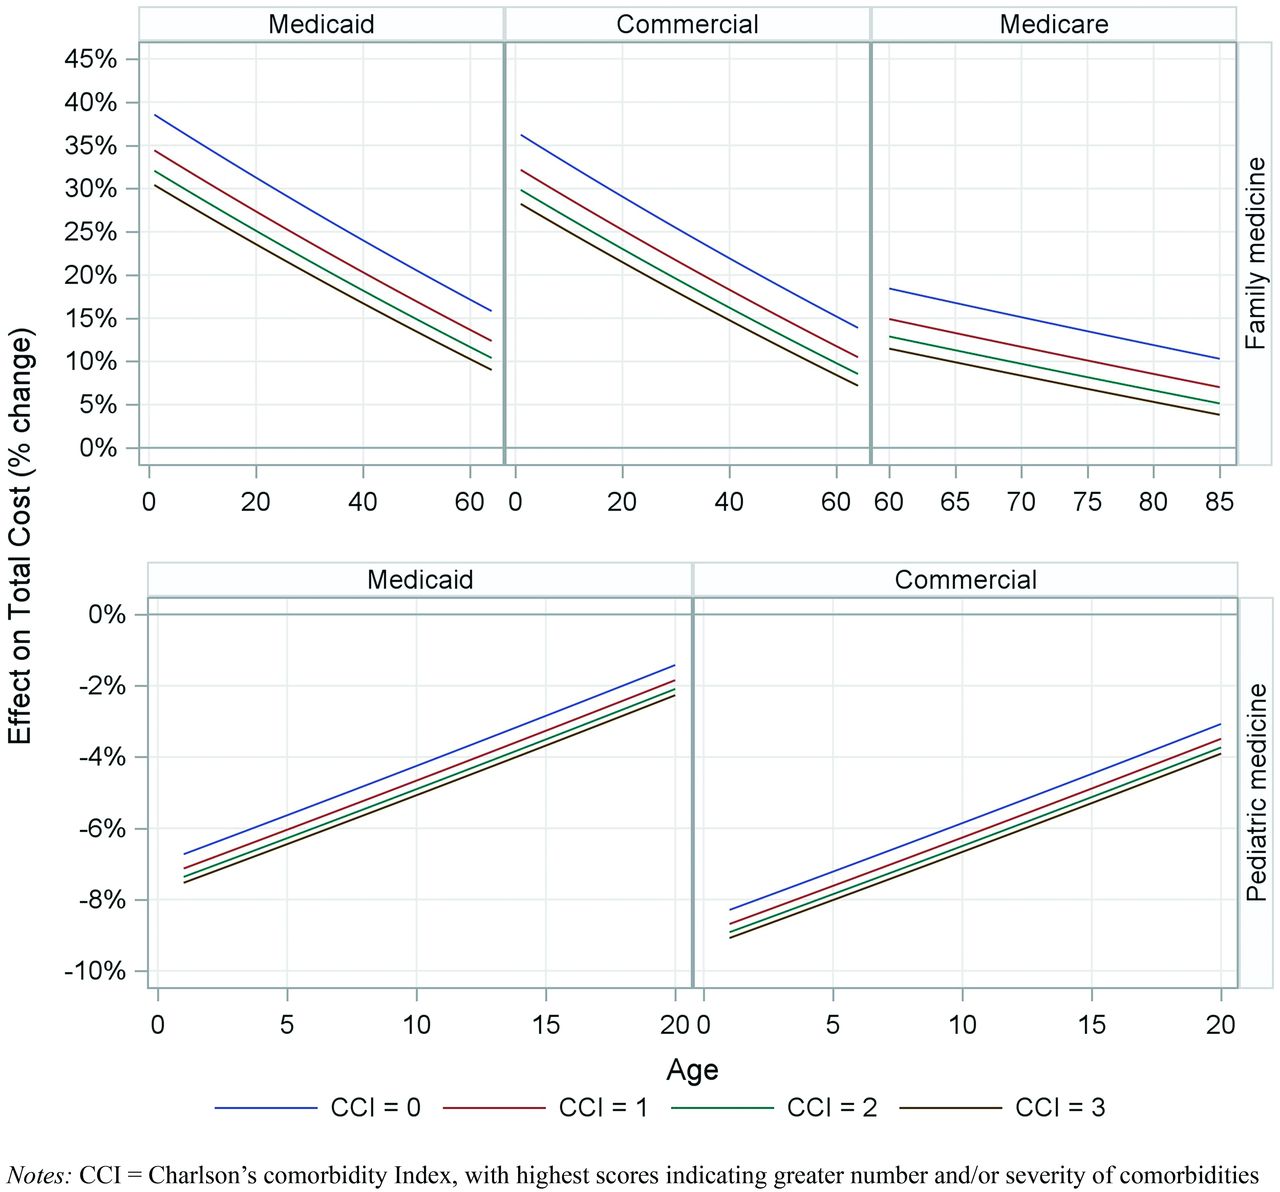
- Figure 1.
Contextualizing the associations between physician-level continuity of care and total cost with patient age and comorbidity.

Tables
Attributed to physicians with bottom (1) to top (5) quintiles of Physician-Level Continuity of Care Patient Sample (n = 1,612,377) Quintile 1 n = 323,115 Quintile 2 n = 319,010 Quintile 3 n = 350,216 Quintile 4 n = 335,228 Quintile 5 n = 284,808 Range of Phy-CoC scores <0.39 0.39-0.55 0.55-0.64 0.64-0.73 >=0.73 Age, mean (SD) 28 (26) 48 (25) 56 (22) 58 (22) 58 (23) Gender Woman 18.8% 20.0% 22.1% 21.7% 17.3% Man 21.6% 19.5% 21.2% 19.6% 18.1% Geography of residence Isolated small rural town 8.6% 15.6% 14.9% 24.6% 36.4% Small rural town 9.7% 12.4% 19.0% 22.2% 36.7% Large rural city/town 15.7% 12.7% 16.3% 24.6% 30.6% Urban 21.3% 20.8% 22.4% 20.4% 15.1% SDI score 29 (29) 26 (26) 30 (29) 33 (30) 36 (30) CCI score 0.7 (1.8) 1.2 (2.3) 1.4 (2.4) 1.6 (2.5) 1.7 (2.6) MARA score 0.6 (1.4) 0.9 (1.7) 1.1 (1.8) 1.2 (1.9) 1.2 (2.0) Utilization outcomes in 2019 Total cost, mean (SD) $5,496 (22,426) $8,428 (23,980) $9,551 (25,197) $10,441 (25,183) $10,777 (25,672) Any preventable hospitalization 0.3% 0.6% 0.8% 0.9% 1.1% Primary insurance payer Medicare 8.3% 16.7% 24.1% 26.7% 24.2% Medicaid 34.7% 19.9% 14.7% 15.4% 15.2% Commercial 26.9% 22.4% 21.2% 16.9% 12.6% Specialty of attributed physician Family medicine 14.7% 21.2% 26.3% 21.2% 16.5% Internal medicine 7.2% 18.3% 22.1% 27.2% 25.1% Pediatric medicine 61.9% 17.7% 5.7% 7.2% 7.4% Abbreviations: SDI, Social deprivation Index; CCI, Charlson’s comorbidity Index; MARA, Milliman Advanced Risk Adjusters; SD, standard deviation.
- Table 2.
Adjusted Associations Between Physician-Level Continuity of Care Quintile, Total Cost, and Preventable Hospitalization
Variable Total Cost% Change (95% CI) Any Preventable HospitalizationOdds Ratio (95% CI) Physician-Level Continuity of Care Quintile Quintile 5 (highest scores) 10.8% (8.1%, 13.7%)* 1.08 (1.01, 1.15) Quintile 4 11.8% (9.1%, 14.6%)* 0.97 (0.91, 1.03) Quintile 3 7.0% (4.4%, 9.6%)* 0.98 (0.92, 1.04) Quintiles 1&2 (lowest scores) – – Age† −0.4% (−0.5%, −0.3%)* 1.16 (1.14, 1.18)* Gender Female 10.5% (10.2%, 10.8%)* 1.22 (1.17, 1.27)* Male – – Geography of residence Isolated small rural town 1.6% (0.5%, 2.7%)* 1.01 (0.90, 1.14) Small rural town 0.8% (−0.3%, 1.9%) 1.25 (1.14, 1.37)* Large rural city/town 1.9% (0.9%, 2.8%)* 1.20 (1.09, 1.31)* Urban – – Primary insurance payer Medicare −34.9% (−35.2%, −34.6%)* 1.56 (1.44, 1.70)* Medicaid −25.0% (−25.5%, −24.6%)* 1.62 (1.43, 1.84)* Commercial – – SDI 75+ 0.3% (−0.2%, 0.8%) 1.08 (1.03, 1.14) 1 to 74 – – CCI (log)† 8.7% (8.6%, 8.7%)* 1.23 (1.22, 1.24)* MARA (log)† 28.8% (28.8%, 28.9%)* 1.49 (1.48, 1.50)* Physician specialty Internal medicine 0.7% (−1.3%, 2.7%) 0.96 (0.92, 1.00) Pediatric medicine −10.4% (−12.4%, −8.3%)* –** Family medicine – – Abbreviations: SDI, Social deprivation Index; CCI, Charlson’s comorbidity Index; MARA, Milliman Advanced Risk Adjusters; CI, confidence interval.
↵Notes: *P < .05.
↵**The specification of preventable hospitalization targets patients aged 18 and older. As a result, patients of pediatricians were excluded from this regression.
†Age centered at 53, estimate of 10-year increase. CCI centered at 0, estimate of 1 point increase. MARA centered at 1, estimate of 1 point increase.
- Table 3.
Adjusted Associations Between Physician-Level Continuity of Care Quintile and Total Cost with Interactions with Patient Characteristics
CoC Interacting with Physician-Level Continuity of Care Quintile† Quintile 3 Quintile 4 Quintile 5 Physician specialty Internal medicine −4.8% (−9.8%, 0.4%) 2.4% (−2.9%, 8.0%) 1.8% (−3.6%, 7.5%) Pediatric medicine −12.6% (−19.6%, −4.9%)* −17.0% (−23.8%, −9.6%)* −26.0% (−31.9%, −19.6%)* Family medicine – – – Primary payer Medicare 1.6% (0.4%, 2.9%)* −1.0% (−2.3%, 0.2%) 2.8% (1.4%, 4.1%)* Medicaid 2.1% (0.4%, 3.8%)* 8.7% (6.9%, 10.5%)* 1.1% (−0.5%, 2.8%) Commercial – – – Patient age† 10 years older −2.7% (−3.0%, −2.4%)* −2.8% (−3.1%, −2.5%)* −3.8% (−4.2%, −3.5%)* CCI (log)† 1 point higher −1.7% (−1.9%, −1.5%)* −2.4% (−2.6%, −2.1%)* −1.7% (−1.9%, −1.4%)* MARA (log)† 1 point higher 1.8% (1.6%, 1.9%)* 1.9% (1.8%, 2.0%)* 1.6% (1.5%, 1.8%)* Abbreviations: CoC, continuity of care; CCI, Charlson’s comorbidity index; MARA, Milliman advanced risk adjusters.
Notes: Estimates of two-way interactions are shown, with all main effects (as in Table 2) included in the model.
↵*P < .05.
↵†Quintiles 1&2 are reference category for CoC. Age centered at 53, estimate of 10-year increase. CCI centered at 0, estimate of 1 point increase. MARA centered at 1, estimate of 1 point increase.
- Appendix A.
Adjusted Associations Between Physician CoC, Total Cost and Preventable Hospitalization: A Sensitivity Analysis of Patients with 2 or More visits in 2019
Variable Total Cost% Change (95% CI) Any Preventable HospitalizationOdds Ratio (95% CI) CoC Quintile 3 5.9% (3.4%, 8.5%)* 1.00 (0.94, 1.07) Quintile 4 10.1% (7.5%, 12.8%)* 0.98 (0.92, 1.05) Quintile 5 8.8% (6.1%, 11.5%)* 1.08 (1.01, 1.15) Quintiles 1&2 – – Age† −1.4% (−1.5%, −1.2%)* 1.16 (1.13, 1.18)* Gender Woman 8.4% (8.0%, 8.7%)* 1.22 (1.17, 1.27)* Man – – Geography of residence Isolated small rural town 1.4% (0.2%, 2.6%)* 1.03 (0.91, 1.16) Small rural town 1.0% (−0.2%, 2.2%) 1.25 (1.14, 1.37)* Large rural city/town 1.8% (0.8%, 2.9%)* 1.17 (1.07, 1.28)* Urban – – Primary insurance payer Medicare −33.7% (−34.1%, −33.4%)* 1.53 (1.40, 1.70)* Medicaid −23.5% (−24.0%, −23.0%)* 1.54 (1.34, 1.78)* Commercial – – SDI 75+ 0.3% (−0.2%, 0.9%) 1.08 (1.02, 1.14) 1 to 74 – – CCI (log)† 7.2% (7.1%, 7.3%)* 1.24 (1.22, 1.25)* MARA (log)† 29.0% (29.0%, 29.1%)* 1.49 (1.48, 1.51)* Physician specialty Internal medicine 0.7% (−1.3%, 2.7%) 0.96 (0.94, 1.07) Pediatric medicine −13.8% (−15.8%, −11.9%)* 0.26 (0.18, 0.39)* Family medicine – – Notes: Estimates of two-way interactions are shown, with all main effects (as in Table 3) included in the model.
↵*P < .05.
↵†Quintiles 1&2 are reference category for CoC. Age centered at 53, estimate of 10-year increase. CCI centered at 0, estimate of 1 point increase. MARA centered at 1, estimate of 1 point increase.
Abbreviations: SDI, social deprivation index; CCI, Charlson’s comorbidity index; MARA, Milliman advanced risk adjusters; CI, confidence interval.
Variable Modeled Coefficients Implied Percent Change Intercept 8.5760 (8.5572, 8.5949) $5303.11 ($5204.00, $5404.11) Age Centered at 53,
Unit Increase of 100.0039 (0.0018, 0.0061) 0.4% (0.2%, 0.6%) Gender Woman 0.0968 (0.0939, 0.0996) 10.2% (9.8%, 10.5%) Man REFERENCE REFERENCE SDI 75+ 0.0035 (−0.0015, 0.0085) 0.3% (−0.1%, 0.8%) 1 to 74 REFERENCE REFERENCE Rurality (From RUCA) Isolated small rural town 0.0155 (0.0047, 0.0264) 1.6% (0.5%, 2.7%) Large rural city/town 0.0053 (−0.0056, 0.0162) 0.5% (−0.6%, 1.6%) Small rural town 0.0179 (0.0083, 0.0276) 1.8% (0.8%, 2.8%) Urban REFERENCE REFERENCE Payer Medicare −0.4286 (−0.4368, −0.4203) −34.9% (−35.4%, −34.3%) Medicaid −0.2960 (−0.3038, −0.2881) −25.6% (−26.2%, −25.0%) Commercial REFERENCE REFERENCE CCI (log) Centered at 0,
Unit Increase of 10.0887 (0.0869, 0.0905) 9.3% (9.1%, 9.5%) MARA (log) Centered at 1,
Unit Increase of 10.2525 (0.2517, 0.2533) 28.7% (28.6%, 28.8%) PCP Specialty Internal medicine 0.0270 (−0.0058, 0.0598) 2.7% (−0.6%, 6.2%) Pediatric medicine 0.1505 (0.1133, 0.1876) 16.2% (12.0%, 20.6%) Family medicine REFERENCE REFERENCE BB-COC-PC of attributed PCP Percentile 40 to 60 0.1293 (0.0966, 0.1620) 13.8% (10.1%, 17.6%) Percentile 60 to 80 0.1642 (0.1296, 0.1989) 17.9% (13.8%, 22.0%) Percentile 80 to 100 0.1612 (0.1234, 0.1991) 17.5% (13.1%, 22.0%) Percentile 0 to 40 REFERENCE REFERENCE Specialty * Age Internal medicine Age Centered at 53,
Unit Increase of 10−0.0205 (−0.0242, −0.0167) −2.0% (−2.4%, −1.7%) Pediatric medicine Age Centered at 53,
Unit Increase of 100.0858 (0.0799, 0.0916) 9.0% (8.3%, 9.6%) Family medicine Age Centered at 53,
Unit Increase of 10REFERENCE REFERENCE MARA * Speciality Internal medicine MARA Centered at 1,
Unit Increase of 10.0098 (0.0082, 0.0115) 1.0% (0.8%, 1.2%) Pediatric medicine MARA Centered at 1,
Unit Increase of 1−0.0300 (−0.0313, −0.0287) −3.0% (−3.1%, −2.8%) Family medicine MARA Centered at 1,
Unit Increase of 1REFERENCE REFERENCE CCI * Speciality Internal medicine CCI Centered at 0,
Unit Increase of 10.0020 (−0.0012, 0.0052) 0.2% (−0.1%, 0.5%) Pediatric medicine CCI Centered at 0,
Unit Increase of 10.0003 (−0.0032, 0.0037) 0.0% (−0.3%, 0.4%) Family medicine CCI Centered at 0,
Unit Increase of 1REFERENCE REFERENCE BB-COC-PC * Specialty Internal medicine Percentile 40 to 60 −0.0468 (−0.1020, 0.0085) −4.6% (−9.7%, 0.9%) Internal medicine Percentile 60 to 80 0.0640 (0.0094, 0.1186) 6.6% (0.9%, 12.6%) Internal medicine Percentile 80 to 100 0.0174 (−0.0388, 0.0736) 1.8% (−3.8%, 7.6%) Internal medicine Percentile 0 to 40 REFERENCE REFERENCE Pediatric medicine Percentile 40 to 60 −0.1665 (−0.2876, −0.0455) −15.3% (−25.0%, −4.4%) Pediatric medicine Percentile 60 to 80 −0.1453 (−0.2626, −0.0281) −13.5% (−23.1%, −2.8%) Pediatric medicine Percentile 80 to 100 −0.0963 (−0.2272, 0.0346) −9.2% (−20.3%, 3.5%) Pediatric medicine Percentile 0 to 40 REFERENCE REFERENCE Family medicine Percentile 40 to 60 REFERENCE REFERENCE Family medicine Percentile 60 to 80 REFERENCE REFERENCE Family medicine Percentile 80 to 100 REFERENCE REFERENCE Family medicine Percentile 0 to 40 REFERENCE REFERENCE BB-COC-PC * Payer Medicare Percentile 40 to 60 0.0126 (0.0001, 0.0250) 1.3% (0.0%, 2.5%) Medicare Percentile 60 to 80 −0.0102 (−0.0229, 0.0026) −1.0% (−2.3%, 0.3%) Medicare Percentile 80 to 100 0.0279 (0.0145, 0.0413) 2.8% (1.5%, 4.2%) Medicare Percentile 0 to 40 REFERENCE REFERENCE Medicaid Percentile 40 to 60 0.0149 (−0.0013, 0.0312) 1.5% (−0.1%, 3.2%) Medicaid Percentile 60 to 80 0.0850 (0.0686, 0.1013) 8.9% (7.1%, 10.7%) Medicaid Percentile 80 to 100 0.0169 (0.0003, 0.0335) 1.7% (0.0%, 3.4%) Medicaid Percentile 0 to 40 REFERENCE REFERENCE Commercial Percentile 40 to 60 REFERENCE REFERENCE Commercial Percentile 60 to 80 REFERENCE REFERENCE Commercial Percentile 80 to 100 REFERENCE REFERENCE Commercial Percentile 0 to 40 REFERENCE REFERENCE BB-COC-PC * Age Percentile 40 to 60 Age Centered at 53,
Unit Increase of 10−0.0173 (−0.0207, −0.0139) −1.7% (−2.1%, −1.4%) Percentile 60 to 80 Age Centered at 53,
Unit Increase of 10−0.0142 (−0.0178, −0.0105) −1.4% (−1.8%, −1.0%) Percentile 80 to 100 Age Centered at 53,
Unit Increase of 10−0.0285 (−0.0324, −0.0245) −2.8% (−3.2%, −2.4%) Percentile 0 to 40 Age Centered at 53,
Unit Increase of 10REFERENCE REFERENCE BB-COC-PC * MARA Percentile 40 to 60 MARA Centered at 1,
Unit Increase of 10.0080 (0.0067, 0.0094) 0.8% (0.7%, 0.9%) Percentile 60 to 80 MARA Centered at 1,
Unit Increase of 10.0087 (0.0073, 0.0102) 0.9% (0.7%, 1.0%) Percentile 80 to 100 MARA Centered at 1,
Unit Increase of 10.0102 (0.0087, 0.0118) 1.0% (0.9%, 1.2%) Percentile 0 to 40 MARA Centered at 1,
Unit Increase of 1REFERENCE REFERENCE BB-COC-PC * CCI Percentile 40 to 60 CCI Centered at 0,
Unit Increase of 1−0.0116 (−0.0142, −0.0090) −1.2% (−1.4%, −0.9%) Percentile 60 to 80 CCI Centered at 0,
Unit Increase of 1−0.0145 (−0.0173, −0.0117) −1.4% (−1.7%, −1.2%) Percentile 80 to 100 CCI Centered at 0,
UnitIncrease of 1−0.0132 (−0.0162, −0.0101) −1.3% (−1.6%, −1.0%) Percentile 0 to 40 CCI Centered at 0,
Unit Increase of 1REFERENCE REFERENCE BB-COC-PC *
Speciality * AgeInternal medicine Percentile 40 to 60 Age Centered at 53,
Unit Increase of 100.0159 (0.0102, 0.0215) 1.6% (1.0%, 2.2%) Internal medicine Percentile 60 to 80 Age Centered at 53,
Unit Increase of 10−0.0009 (−0.0066, 0.0048) −0.1% (−0.7%, 0.5%) Internal medicine Percentile 80 to 100 Age Centered at 53,
Unit Increase of 100.0077 (0.0018, 0.0136) 0.8% (0.2%, 1.4%) Internal medicine Percentile 0 to 40 Age Centered at 53,
Unit Increase of 10REFERENCE REFERENCE Pediatric medicine Percentile 40 to 60 Age Centered at 53,
Unit Increase of 10−0.0120 (−0.0316, 0.0076) −1.2% (−3.1%, 0.8%) Pediatric medicine Percentile 60 to 80 Age Centered at 53,
Unit Increase of 100.0028 (−0.0148, 0.0204) 0.3% (−1.5%, 2.1%) Pediatric medicine Percentile 80 to 100 Age Centered at 53,
Unit Increase of 100.0576 (0.0362, 0.0790) 5.9% (3.7%, 8.2%) Pediatric medicine Percentile 0 to 40 Age Centered at 53,
Unit Increase of 10REFERENCE REFERENCE Family medicine Percentile 40 to 60 Age Centered at 53,
Unit Increase of 10REFERENCE REFERENCE Family medicine Percentile 60 to 80 Age Centered at 53,
Unit Increase of 10REFERENCE REFERENCE Family medicine Percentile 80 to 100 Age Centered at 53,
Unit Increase of 10REFERENCE REFERENCE Family medicine Percentile 0 to 40 Age Centered at 53,
Unit Increase of 10REFERENCE REFERENCE BB-COC-PC * MARA * Speciality Internal medicine Percentile 40 to 60 MARA Centered at 1,
Unit Increase of 1−0.0039 (−0.0064, −0.0014) −0.4% (−0.6%, −0.1%) Internal medicine Percentile 60 to 80 MARA Centered at 1,
Unit Increase of 1−0.0019 (−0.0043, 0.0006) −0.2% (−0.4%, 0.1%) Internal medicine Percentile 80 to 100 MARA Centered at 1,
Unit Increase of 1−0.0075 (−0.0100, −0.0049) −0.7% (−1.0%, −0.5%) Internal medicine Percentile 0 to 40 MARA Centered at 1,
Unit Increase of 1REFERENCE REFERENCE Pediatric medicine Percentile 40 to 60 MARA Centered at 1,
Unit Increase of 1−0.0002 (−0.0044, 0.0040) −0.0% (−0.4%, 0.4%) Pediatric medicine Percentile 60 to 80 MARA Centered at 1,
Unit Increase of 1−0.0010 (−0.0047, 0.0027) −0.1% (−0.5%, 0.3%) Pediatric medicine Percentile 80 to 100 MARA Centered at 1,
Unit Increase of 1−0.0144 (−0.0182, −0.0106) −1.4% (−1.8%, −1.1%) Pediatric medicine Percentile 0 to 40 MARA Centered at 1,
Unit Increase of 1REFERENCE REFERENCE Family medicine Percentile 40 to 60 MARA Centered at 1,
Unit Increase of 1REFERENCE REFERENCE Family medicine Percentile 60 to 80 MARA Centered at 1,
Unit Increase of 1REFERENCE REFERENCE Family medicine Percentile 80 to 100 MARA Centered at 1,
Unit Increase of 1REFERENCE REFERENCE Family medicine Percentile 0 to 40 MARA Centered at 1,
Unit Increase of 1REFERENCE REFERENCE BB-COC-PC * CCI * Speciality Internal medicine Percentile 40 to 60 CCI Centered at 0,
Unit Increase of 1−0.0058 (−0.0105, −0.0011) −0.6% (−1.0%, −0.1%) Internal medicine Percentile 60 to 80 CCI Centered at 0,
Unit Increase of 1−0.0136 (−0.0182, −0.0091) −1.4% (−1.8%, −0.9%) Internal medicine Percentile 80 to 100 CCI Centered at 0,
Unit Increase of 1−0.0032 (−0.0080, 0.0016) −0.3% (−0.8%, 0.2%) Internal medicine Percentile 0 to 40 CCI Centered at 0,
Unit Increase of 1REFERENCE REFERENCE Pediatric medicine Percentile 40 to 60 CCI Centered at 0,
Unit Increase of 10.0110 (0.0002, 0.0217) 1.1% (0.0%, 2.2%) Pediatric medicine Percentile 60 to 80 CCI Centered at 0,
Unit Increase of 10.0053 (−0.0048, 0.0154) 0.5% (−0.5%, 1.6%) Pediatric medicine Percentile 80 to 100 CCI Centered at 0,
Unit Increase of 10.0113 (0.0008, 0.0217) 1.1% (0.1%, 2.2%) Pediatric medicine Percentile 0 to 40 CCI Centered at 0,
Unit Increase of 1REFERENCE REFERENCE Family medicine Percentile 40 to 60 CCI Centered at 0,
Unit Increase of 1REFERENCE REFERENCE Family medicine Percentile 60 to 80 CCI Centered at 0,
Unit Increase of 1REFERENCE REFERENCE Family medicine Percentile 80 to 100 CCI Centered at 0,
Unit Increase of 1REFERENCE REFERENCE Family medicine Percentile 0 to 40 CCI Centered at 0,
Unit Increase of 1REFERENCE REFERENCE Abbreviations: SDI, social deprivation index; CCI, Charlson’s comorbidity index; MARA, Milliman advanced risk adjusters; CI, confidence interval.
In this issue


Jump to section
Related Articles
Cited By...
- No citing articles found.