
Abstract
Background: Ordering a serologic test for infectious mononucleosis (IM) in all young patients with sore throat is costly and impractical. The test threshold to determine when to order a diagnostic test for IM based on the patient’s symptoms has not been previously studied.
Objective: To determine the test threshold for IM in the management of patients with sore throat.
Design and Setting: Online surveys were sent to a convenience sample of US primary care clinicians regarding their decision making about whether or not to order a test for IM in a patient with sore throat.
Method: 7 clinical vignettes were created, each with a different combinations of symptoms and signs. The probability of IM for each vignette was estimated by the investigator based on the number of symptoms present to generate a plausible range of disease probabilities. Clinicians were then asked to decide whether to test or not test for IM, and mixed-effect logistic regression was used to determine the test threshold for IM where half of physicians chose to test and half chose not to test.
Results: A total of 117 clinicians provided responses for a total of 819 clinical vignettes. The overall test threshold for IM as estimated using the logistic regression was 9.5% (95% CI: 8.2% to 10.9%). The test threshold for clinicians practicing greater than 10 years was significantly higher than for those practicing less or equal to 10 years (10.5% vs 7.3%, P = .02). No significant differences between specialties and practice sites were found with respect to the test threshold.
Conclusion: This study identified a test threshold for IM of approximately 10% based on realistic clinical vignettes. This threshold was stable regarding the clinician’s specialty and practice sites and could be used in the development of a clinical prediction rule to determine the cutoff for low- versus high-risk groups.
- Clinical Prediction Rule
- Evidence-Based Medicine
- Infectious Mononucleosis
- Logistic Models
- Pharyngitis
- Primary Health Care
- Routine Diagnostic Tests
Background
Infectious mononucleosis (IM) is a common disease caused by Epstein-Barr virus (EBV) among adolescents and children. The most common symptoms and signs associated with IM include sore throat, fever, cervical adenopathy, and fatigue.1⇓⇓–4 Other clnical symptoms and signs of IM include rash, headache, nausea, jaundice, axillary or inguinal adenopathy, muscle or joint pain, and splenomegaly. The diagnostic accuracy of individual symptoms and signs of IM has been inconsistent among studies.5,6 Heterophile antibody tests are a rapid and cost-effective test for IM, but the heterophile antibody tests are less sensitive compared with viral capsid antigen (VCA) tests, especially in EBV-infected children. The EBV specific tests such as a viral capsid antigen test are more sensitive in the early stages of an acute infection.6,7 However, it would be costly and impractical to order a serologic test in all patients with sore throat in routine practice.8
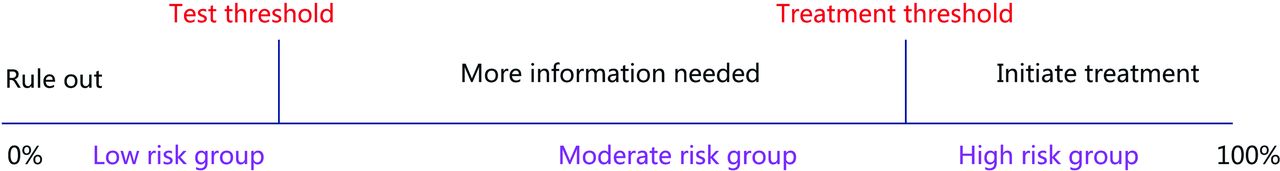
The disease threshold model proposes 2 clinical decision thresholds: the test threshold and the treatment threshold (Figure 1).9 The test threshold is the probability at which the clinician decides to either rule out the disease or to obtain additional data. The treatment threshold is the probability at which clinicians decide to either gather additional data or to initiate treatment. There are 3 options for patients with suspected illness: if the probability of disease falls below the test threshold, the disease will be ruled out. If the probability falls between the test threshold and treatment threshold, then more information is needed for the diagnosis. If the probability falls above the treatment threshold, then treatment should be initiated.

Illustration of the threshold model.
The originators of the threshold model proposed an explicit approach to calculating decision thresholds based on the benefits and harms of missed versus correct diagnosis and appropriate versus inappropriate diagnosis. One of the authors in a previous study10 developed a novel implicit approach to determining decision thresholds by presenting physicians with a series of clinical vignettes, each with a different disease prevalence that represent a range of probability of disease. Physicians were asked to choose among ruling the disease out, ordering an additional test, or initiating therapy. The thresholds were then estimated using a logistic regression model. The test threshold is the “tipping point” at which a decision was made to either rule out disease versus gathering more information, whereas the treatment threshold is the tipping point at which a decision was made to either gather more information or initiate treatment. Because there is no specific medication available to treat IM, and antibiotics do not work against EBV infection, the treatment threshold for IM was not considered in this study.
The test threshold for IM diagnosis has not been previously studied. It is also uncertain if the thresholds for IM differ by years in practice. medical specialty, or their practice site. The result of the test threshold from this study could guide the development of clinical prediction rules (CPRs) for IM. The developers should ensure that the low-risk group of IM from the CPRs correspond to the disease probability less than the proposed threshold, and the high-risk group correspond to the probability of IM greater than or equal to the proposed threshold. This study will adopt the previous technique10 and use detailed, realistic online vignettes that vary the likelihood of IM among patients presenting with a sore throat to explore the effect of physician decisions regarding testing for IM.
Methods
Participants
We recruited a convenience sample of primary care physicians and emailed a participation invitation nationwide from spring to fall 2020. Attached to this e-mail was a link to an online questionnaire about an IM test threshold. The investigators administered the survey using Qualtrics, provided through the University of Georgia (UGA), which provides a secure and automated method for data collection. Respondents could access the online survey either on a mobile phone or on a personal computer. All participants who submitted the Qualtrics survey were included in the study. All surveys were completed anonymously, and each IP address could only be used once to avoid duplicate responses.
Study Design
This was a cross-sectional study of clinicians regarding their clinical decision making regarding the diagnosis of IM in an outpatient setting with the availability of the office-based examination for IM. After informed consent was given, each clinician was asked about their medical specialty (family medicine, internal medicine, physician assistant, or nurse practitioner), years in practice, practice site (primary care, urgent care, or emergency department), and whether they are working at a university health center. Then, each clinician was presented with 7 separate clinical scenarios of patients with a sore throat and different combinations of signs and symptoms, corresponding to an estimated likelihood of IM ranging from 1% to 30%. Participants were told to assume that each scenario took place in 2019, and COVID-19 was not a potential cause of the patient’s symptoms and signs. A summary table of the clinical presentations for each scenario given to clinicians is shown in Online Appendix Table 1. For each scenario, the likelihood of IM was given to the clinician based on expert opinion and a previous meta-analysis by the coinvestigator on the accuracy of the symptoms and signs for the diagnosis of IM. The vignettes are shown in Online Appendix Table 1.11 The clinicians were told that the heterophile antibody test, the “Monospot” test, is the only confirmatory test available to the physicians for diagnosing IM. The “Monospot” test is considered to be 80% sensitive in the first 7 days of infection and 95% sensitive after 7 days. Each clinician was then asked to select from 1 of the management options below for each of 7 clinical vignettes:
• You feel that IM is unlikely, and you will not order any tests for IM.
• You feel that more information is needed, and you will order a “Monospot” test.
Demographic Characteristics of the Participating Clinicians
In the threshold model, these 2 options are consistent with being below the test threshold and being above the test threshold, respectively.
Analysis
For the descriptive analysis, we summarized the characteristics of each participating clinician. We also summarized the frequencies and the percentage of clinicians ruling out IM for each vignette.
The test threshold was determined by adopting the method described in a previous study.10 This method is based on a logistic regression analysis of the physician decision regarding the disease probability. The following logistic regression equation was used to determine the test threshold:
 Equation 1where p is the probability that a clinician decided not to rule out the disease and to order a diagnostic test when the test threshold is being estimated; the value x is the probability of IM predetermined by the investigator for each vignette; a and b are the model coefficients.
The test threshold of disease is defined as the probability of disease where 50% of the clinicians would decide to rule out disease and the other 50% decide to order diagnostic test or initiate treatment. Thus, we defined the probability of ordering a test for IM  at the test threshold as equal to 0.5. At this probability, 50% of the clinicians would rule out IM without ordering additional test and another 50% of clinicians would decide to order the “Monospot” test to confirm IM. Thus, ln(0.50/0.50) = ln(1) = 0. The following equation is obtained after solving Equation 1 for x and replacing p with
  ,
,
 Equation 2where
  and
and  were the coefficients estimated from Equation 1. The resulting Xtest was deemed as a test threshold. Because each clinician needed to evaluate 7 scenarios, mixed-effect logistic regression models were used, and we applied a random intercept term to Equation 1 to adjust for interphysician variability. The confidence intervals of the test threshold for IM were determined by using the covariance matrix for the estimated coefficients in the model.12
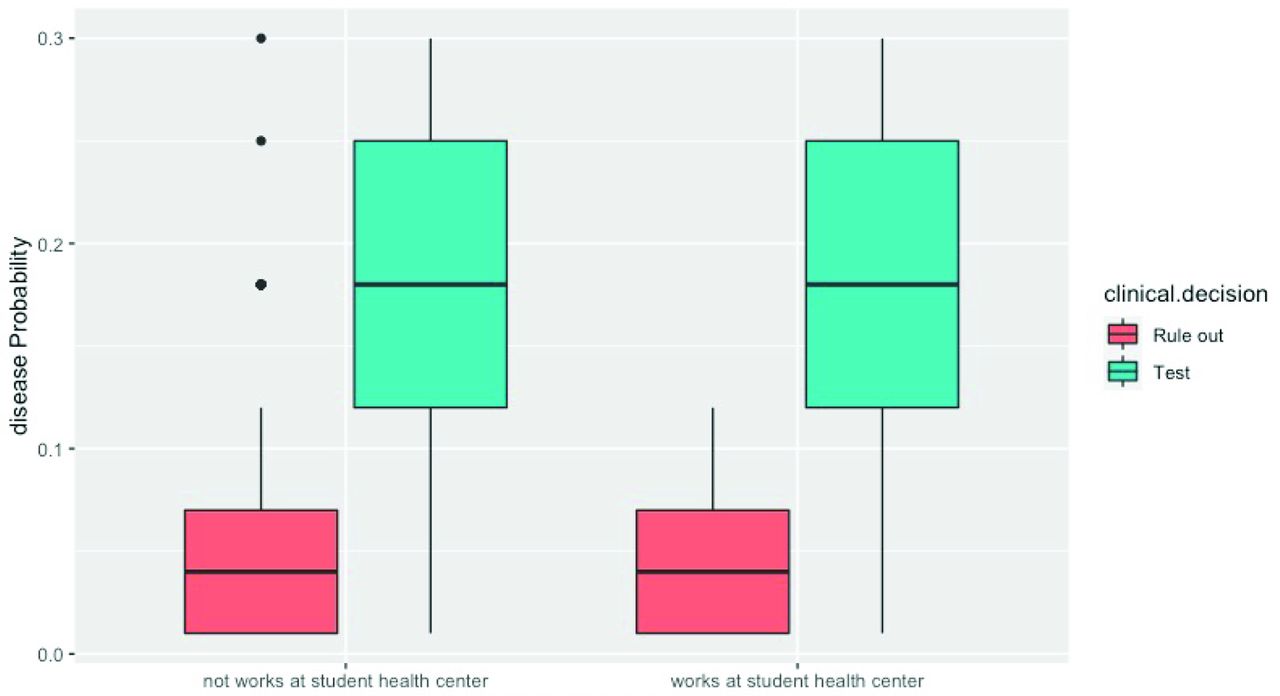
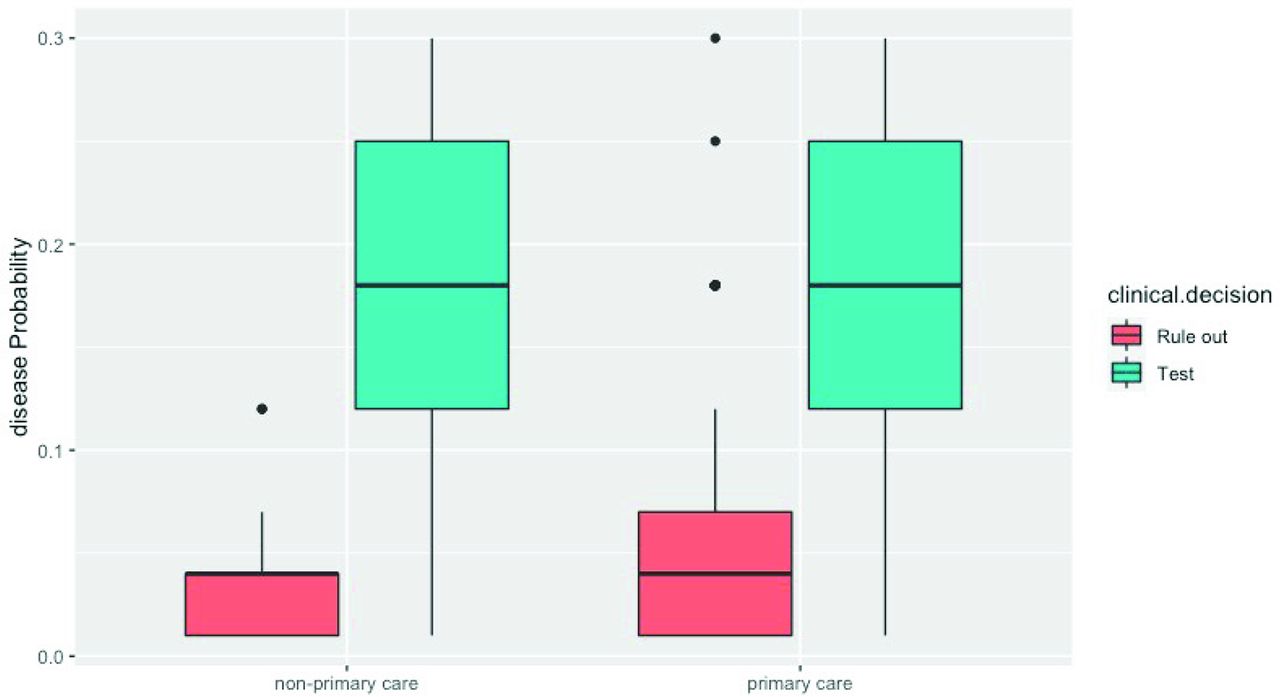
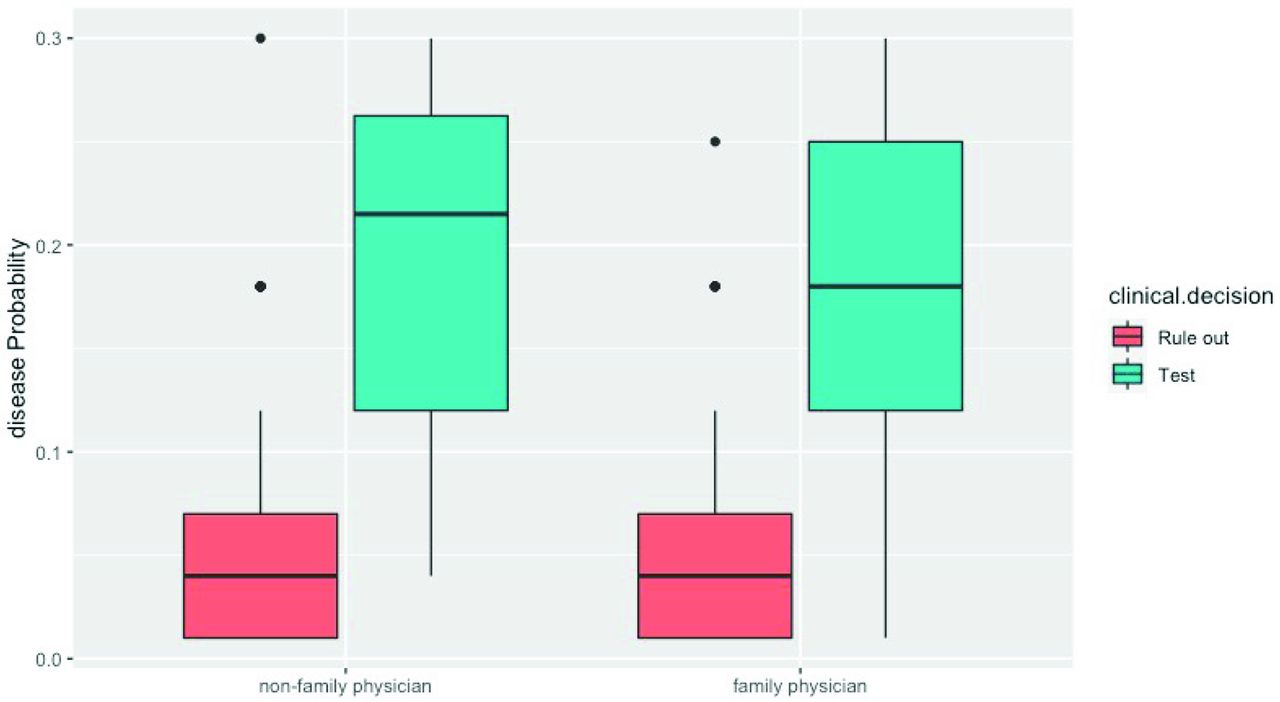
To achieve the subgroup comparison, the test threshold model was also stratified by years of medical practice (<=10 years vs >10 years), practice sites (primary care vs Nonprimary care), clinician specialties (family physician vs Nonfamily physician), and whether they work at a student health center.
All statistical analyses were performed using R software version with version 3.0.2.13 The mixed-effect logistic regression was implemented by glmer function from lme4 package.
Ethical Approval
This study was approved by the Human Subjects Committee of the University of Georgia, and we received informed consent from all participating clinicians.
Results
Characteristics of Participants
A total of 136 clinicians responded to the invitation and answered the survey, of whom 122 provided useable data regarding their training or background and 117 clinicians provided usable data regarding the clinical decisions. The demographic characteristics of the 122 participants are summarized in Table 1.
Overall, 117 participating clinicians provided their clinical decisions for a total of 819 clinical vignettes. Most clinicians worked in a primary care setting (82.8%), 83.6% were in family medicine, and approximately 72% of the clinicians had been practicing medicine for more than 10 years. Only 11.5% of clinicians worked in a student health center. The percentage of clinicians not ordering a test for IM ranged from 92.6% for scenario 1 (1% estimated probability of IM) to 0.8% for scenarios 6 and 7 (25% to 30% estimated probabilities of IM).
The distribution of the vignette probabilities of IM for clinicians choosing to order a test and for those not ordering a test (“rule out”) are shown in the box and whisker plot in Figure 2; the probabilities in different subgroups are displayed in box plots in Online Appendix Figures 1-4. The median and interquartile range of vignette probabilities for clinicians deciding that a test was indicated versus those not ordering a test are shown in Online Appendix Table 2. The probability of IM was less than 8% for most physicians who ruled out the diagnosis, and among those who ordered a diagnostic test, the probability of disease ranged from 12% to 25%.
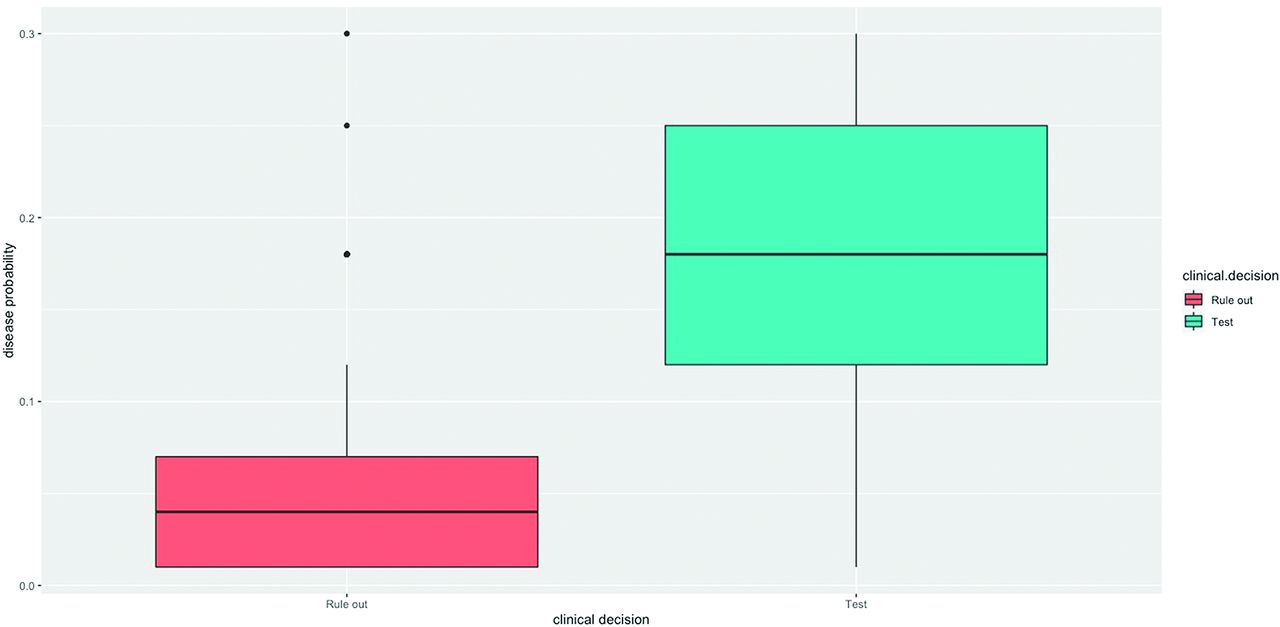
The distributions of probabilities for clinicians choosing to order a test for Infectious Mononucleosis (IM) and those choosing not to order a test (rule out).

Test (blue solid line) threshold based on the logistic regression model, obtained equaling to 0.5 of the probability of not ruling out Infectious Mononucleosis (IM) (test threshold) estimated according to model 2. Points (circles) represent the true probability of clinicians that decided to rule in IM and to order a diagnostic test for each scenario.
Estimation of Overall Test Threshold and By Subgroups
Test Thresholds Estimation
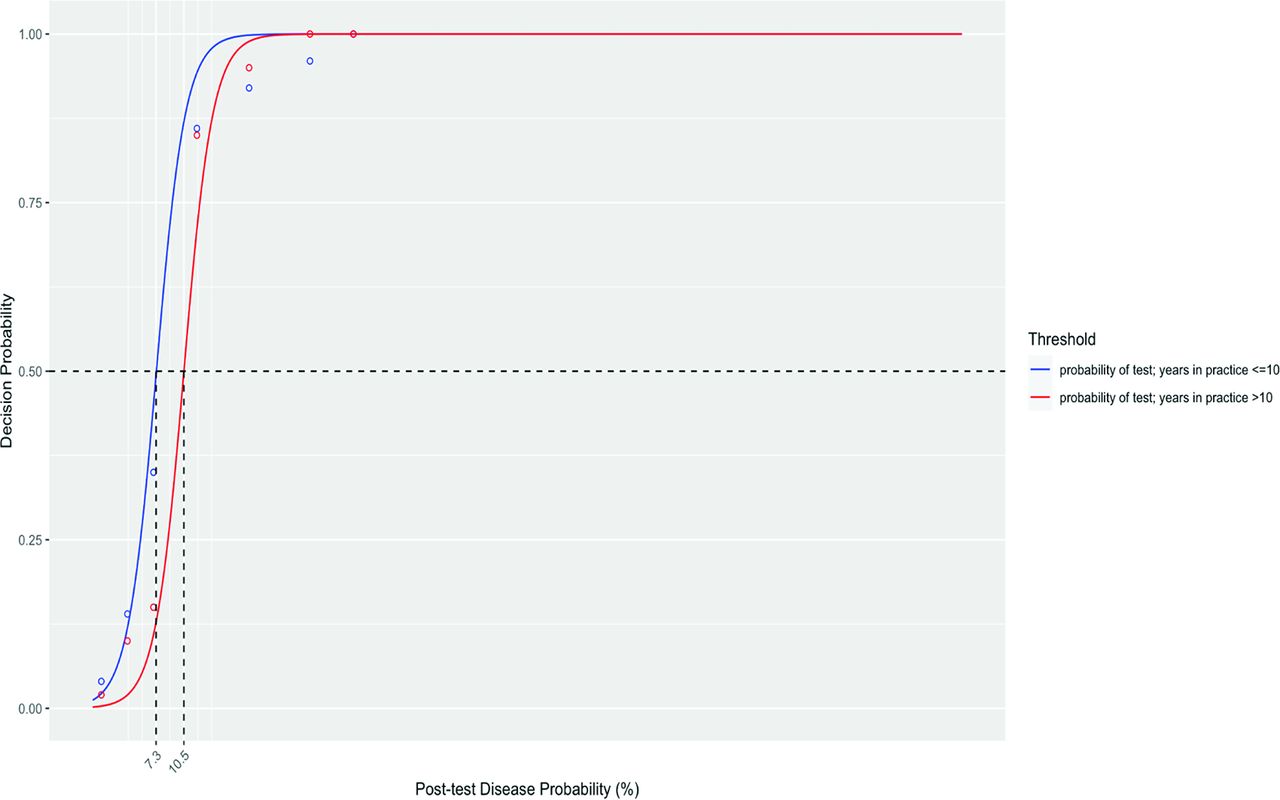
The overall test threshold for IM as estimated using the mixed-effect logistic regression model was 9.5% (95% CI: 8.2% to 10.9%) (Table 2 and Figure 2). For the stratified analysis of test thresholds, the test threshold for clinicians practicing greater than 10 years was significantly greater than for those practicing less or equal to 10 years (10.5% vs 7.3%, P = .02). No significant differences among other subgroups were found with respect to the test threshold. The test thresholds derived for different subgroups are presented in Online Appendix Figures 5-8.
Discussion
This is the first study to determine the test threshold for IM using a set of realistic clinical vignettes with the probability of IM varying from 1% to 30%. In the context of an outpatient visit for a patient with sore throat, clinicians had an implicit test threshold of just under 10% for ordering a test for IM in a patient presenting with sore throat.
The test threshold for IM was stable across different specialties and practice sites. Thus, this threshold can be used by clinicians regardless of their specialties and/or work site. On the other hand, the test threshold was found to be significantly higher if clinicians had been in practice for greater than 10 years (10.5% vs 7.3%). This may reflect that late-career physicians are more confident in ruling-out disease without testing. However, given the small sample size in this study, this conclusion may be considered as hypothesis generating, and a study with a larger sample size would be required to support this finding.
The test threshold identified from our study can guide the clinician’s decision-making process for IM diagnosis. If the pretest probability of IM for a patient with a sore throat is much below 10% (ie, 5%), we would assume this patient has a low risk of IM, and the physicians can rule out IM without further testing for IM; if the pretest probability is much greater than 10% (ie, 15%), we would assume this patient has a high risk of IM, and a confirmatory test for IM should be ordered. On the other hand, if the pretest probability of IM for a patient is judged to be close to 10% (ie, the estimated probability of IM is between 5% and 15%), we would assume this patient has a high risk of IM, and the physicians need to use their judgment to make their final decision. The authors have developed a simple risk score based on the symptoms and signs for the diagnosis of IM among college students (X. Cai & M.H. Ebell, to be submitted for publication). By using our estimated test threshold of 10%, we identified patients in low- (LR-: 0.5) and high-risk (LR+: 2.46) groups for IM. Given an estimated probability of IM of 8% for adolescents aged 16 to 20 years with a sore throat based on an Australian primary care study,14 our risk scores would reduce the probability of IM to 4% for patients in the low-risk group, obviating the need for a confirmatory test; and would increase the likelihood of IM to 17% for patients in the high-risk group, for whom IM testing is recommended.
Future studies should investigate the test threshold for IM in a real patient setting. We could directly observing the clinicians’ decision making process in the course of consultations with real patients in front of them. We would ask the physicians to estimate the probability of IM and to make their clinical decisions on IM testing for each visit. Observing the clinicians’ behavior in the real patient setting would allow clinicians to include other factors in the decision, such as patient’s attitude or expectations, that could not be measured using the simulated vignettes.
Strengths and Limitations
This is the first study to use realistic clinical vignettes to study clinician decision making regarding IM testing for patients with sore throat. The study design also allows us to compare the clinicians’ clinical decisions across different practice settings and helps us to estimate the threshold with greater precision.
However, several limitations exist in this study. First, the response rate for this study could not be calculated due to the use of an online convenience sample. Primary care physicians with more experiences in IM diagnosis might be more interested in this project and therefore be more likely to participate, which would lead to the selection bias. On the other hand, greater experience might lead to more informed testing decisions regarding IM. Second, this study provided only 7 vignettes to each clinician, with the likelihood of IM ranging from 1% to 30%. Observing clinicians with real patients and asking clinicians to estimate the probability of IM for each visit should be considered. This would allow the clinicians to account for the severity of symptoms, as well as the patients’ attitudes and beliefs. In addition, the probability of IM in each vignette was provided instead of having the physician estimate it, and the stated disease probability in each vignette might potentially have influenced the physicians’ clinical decisions. Intuitive clinical decision making is a complex process and involves different levels of uncertainty, and this process might not be sufficiently captured by the probability of disease.
Third, this study might not have fully captured all management options by offering only 2 options (do not order a test [rule out] or order a test) for each vignette and limiting the diagnostic testing options for IM to the Monospot test. Some physicians may prefer a viral capsid antigen test as a diagnostic test for IM, because the heterophile antibody tests are relatively specific yet somewhat insensitive (as many as 24% of false negatives), especially in the first week of IM illness. Future studies would provide more options for diagnostic testing and provide the opportunity to compare the decision making in regard to different serologic test options. Finally, there are other approaches to determining thresholds including the cost-benefit analytic approach of Pauker and Kassirer, which might identify a different test threshold.9 It is also possible that asking the physician to estimate the probability of IM for the vignette rather than giving them the probability could have resulted in a different threshold. However, we feel that the identified threshold has good face validity.
Conclusions
This study used realistic clinical vignettes to study clinical decision making regarding diagnostic testing for patients with sore throat by varying the likelihood of IM among patients in the vignettes. Using this approach, we estimated that the test threshold for ordering a Monospot test for IM in someone with sore throat is approximately 10%. This threshold did not vary with the clinician’s specialty or practice site.
The results from the current threshold study are being used to identify the cutoffs for 2 newly proposed clinical decision rules for the management of IM (manuscript in review). The CDRs classify patients into low- and high-risk groups for IM, with probabilities of IM less than 10% and greater than or equal to 10%. We believe that choosing a cutoff that reflects the implicit test threshold of experienced clinicians situates it in the clinical context and makes it potentially more acceptable to users.
Appendix
Appendices
Below are the complete vignettes including the instructions given to the clinician:
Please assume that the “Monospot” test for infectious mononucleosis that your clinic uses is 80% sensitive in the first 7 days of infection and 95% sensitive after 7 days. This is the only test available to you for diagnosing mononucleosis.
Scenario 1: A 30-year-old female comes to your office. She reports a 10-day history of sore throat accompanied by a skin rash. On examination, her tonsils are normal, and she has no posterior cervical adenopathy. She did not visit any doctor or order any test since her symptom onset. She denies shortness of breath, coughing, sore muscles or joints, sleeping too much, feeling nausea or feverish, headache, and is otherwise healthy with no serious comorbidities. Based on a validated clinical prediction rule, her probability of IM is approximately 1%.
Scenario 2: A 30-year-old female comes to your office. She reports a 10-day history of sore throat and coughing accompanied by a skin rash. On examination, her tonsils are normal, and she has no posterior cervical adenopathy. She did not visit any doctor or order any test since her symptom onset. She denies shortness of breath, sore muscles or joints, sleeping too much, feeling nausea, feverish or headache, and is otherwise healthy with no serious comorbidities. Based on a validated clinical prediction rule, her probability of IM is approximately 4%.
Scenario 3: A 24-year-old female comes to your office. She reports a 6-day history of sore throat, coughing, sore muscles and joints, accompanied by a skin rash. On examination, her tonsils are normal, and she has no posterior cervical adenopathy. Her spleen is in normal size. She came to see the doctor 3 days after the sore throat began and had a negative strep test at that time. However, her sore throat persists. She denies shortness of breath, sleeping too much, feeling nausea, feverish or headache, and is otherwise healthy with no serious comorbidities. Based on a validated clinical prediction rule, her probability of IM is approximately 7%.
Scenario 4: An 18-year-old female student comes to your office. She reports a 10-day history of sore throat and coughing. She started experiencing sore muscles and joints, feeling nausea, sleeping too much accompanied by a skin rash a week ago. On examination, her tonsils are normal, and she has no posterior cervical adenopathy. She came to see the doctor 3 days after the sore throat began and had a negative strep test at that time, but her symptoms have persisted. She denies shortness of breath, feverish or headache, and is otherwise healthy with no serious comorbidities. Based on a validated clinical prediction rule, her probability of IM is approximately 12%.
Scenario 5: An 18-year-old female student comes to your office. She reports a 10-day history of sore throat and coughing. She started experiencing sore muscles and joints, sleeping too much, feeling nausea, feverish and headache accompanied by a skin rash a week ago. On examination, her tonsils are normal, and she has no posterior cervical adenopathy. She came to see the doctor 3 days after the sore throat began and had a negative strep test at that time, but her symptoms have persisted. She denies shortness of breath and is otherwise healthy with no serious comorbidities. Based on a validated clinical prediction rule, her probability of IM is approximately 18%.
Scenario 6: An 18-year-old female student comes to your office. She reports a 10-day history of sore throat and coughing. She started experiencing sore muscles and joints, sleeping too much, feeling nausea, feverish and headache accompanied by a skin rash a week ago. On examination, her tonsils are enlarged with exudate, and she has no posterior cervical adenopathy. She came to see the doctor 3 days after the sore throat began and had a negative strep test at that time, but her symptoms have persisted. She denies shortness of breath and is otherwise healthy with no serious comorbidities. Based on a validated clinical prediction rule, her probability of IM is approximately 25%.
Scenario 7: An 18-year-old female student comes to your office. She reports a 10-day history of sore throat and coughing. She started experiencing sore muscles and joints, sleeping too much, feeling nausea, feverish and headache accompanied by a skin rash a week ago. On examination, her tonsils are enlarged with exudate, and presented with posterior cervical adenopathy. She came to see the doctor 3 days after the sore throat began and had a negative strep test at that time, but her symptoms have persisted. She denies shortness of breath and is otherwise healthy with no serious comorbidities. Based on a validated clinical prediction rule, her probability of IM is approximately 30%.
Box plots displaying the distribution of decision probabilities for infectious mononucleosis with subgroups.
Test threshold based on the logistic regression model by subgroups, obtained equaling to 0.5 of the probability of not ruling out IM (test threshold) estimated according to model 2. Points (circles) represent the true probability of clinicians that decided to rule in IM and to order a diagnostic test for each scenario.
Derivation of the Confidence Intervals for the Test Thresholds
To obtain the test threshold, we estimated model (1) (see Section Methods, Analysis):
 (1)being
  the probability of not ruling out,
x the disease probability, and
the probability of not ruling out,
x the disease probability, and  , and
, and  the model coefficients. The test threshold was obtained inverting (1) and replacing
p with
the model coefficients. The test threshold was obtained inverting (1) and replacing
p with  . Since
  , we obtained:
 (2)To find 95% confidence intervals for
  we used the result (Carter et al. 1983, Pencina et al. 1992):
 (3)With
 and with all variances
V and covariances
C being estimated by the model. A 95% CI for
and with all variances
V and covariances
C being estimated by the model. A 95% CI for  could thus be obtained by solving with respect to
  the following 2
 degree inequality:
 (4)being 3.84 the 95% quantile of a Chi2 distribution with 1 degree of freedom.
Inequality (4) can be written as follows:
 Let
Let


 be the coefficients of the 2
 degree inequality (4).
Finally, a 95% CI for  takes the form:
 The 95% CI for the treatment threshold
  is obtained applying the same method to model
(2): ln
The Signs, Symptoms and Probability of (IM) for each Clinical Vignette
Median and Interquartile Range for the Probability of Infectious Mononucleosis (IM) in the Vignettes Stratified by Clinical Decision and Physician Characteristics

Distribution of the decision probabilities for subgroups: <=10 years’ practice versus >10 years’ practice.

Distribution of the decision probabilities for subgroups: works at student health center versus not works at student health center.

Distribution of the decision probabilities for subgroups: primary care physician versus Nonprimary care physician.

Distribution of the decision probabilities for subgroups: family physician versus nonfamily physician.

Test threshold by subgroups: Primary care physician versus nonprimary care physician.
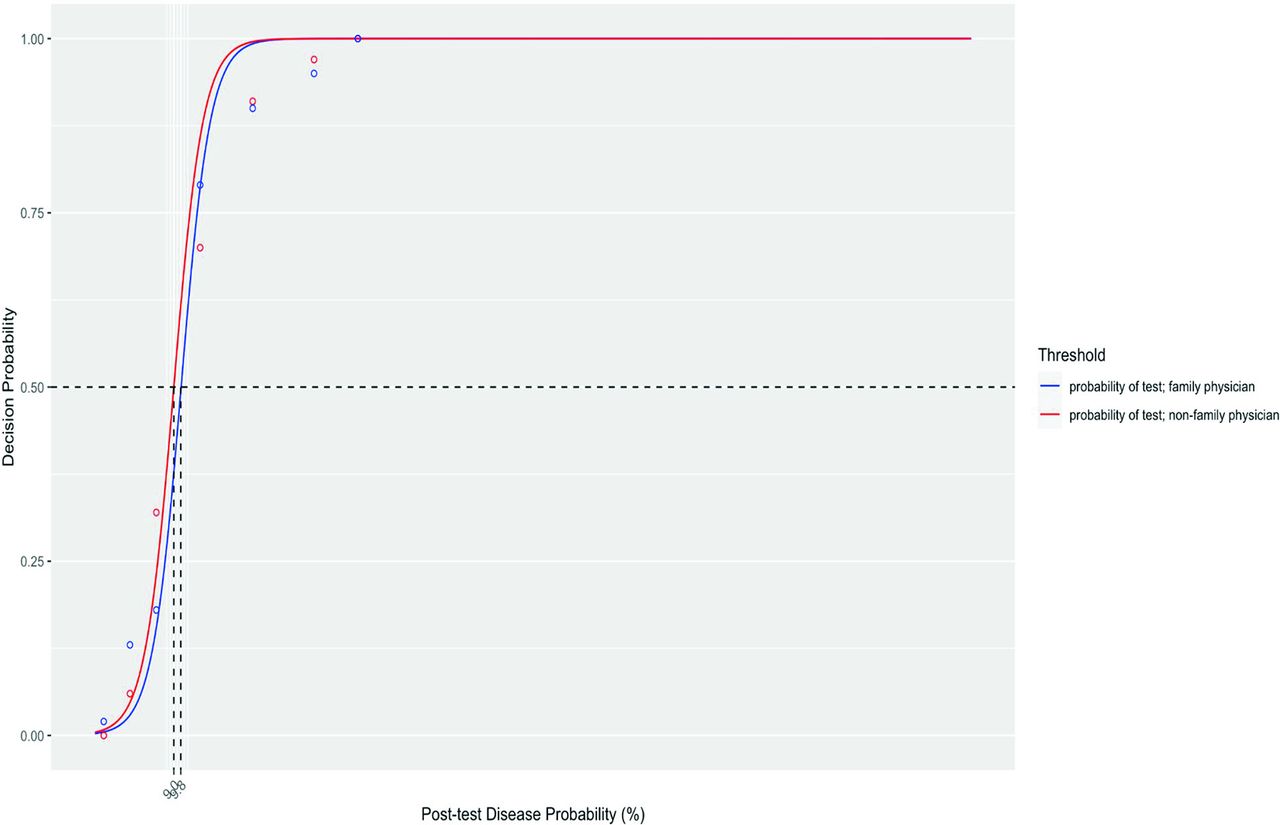
Test threshold by subgroups: family physician versus nonfamily physician.

Test threshold by subgroups: ≤10 years in practice versus >10 years clinicians.
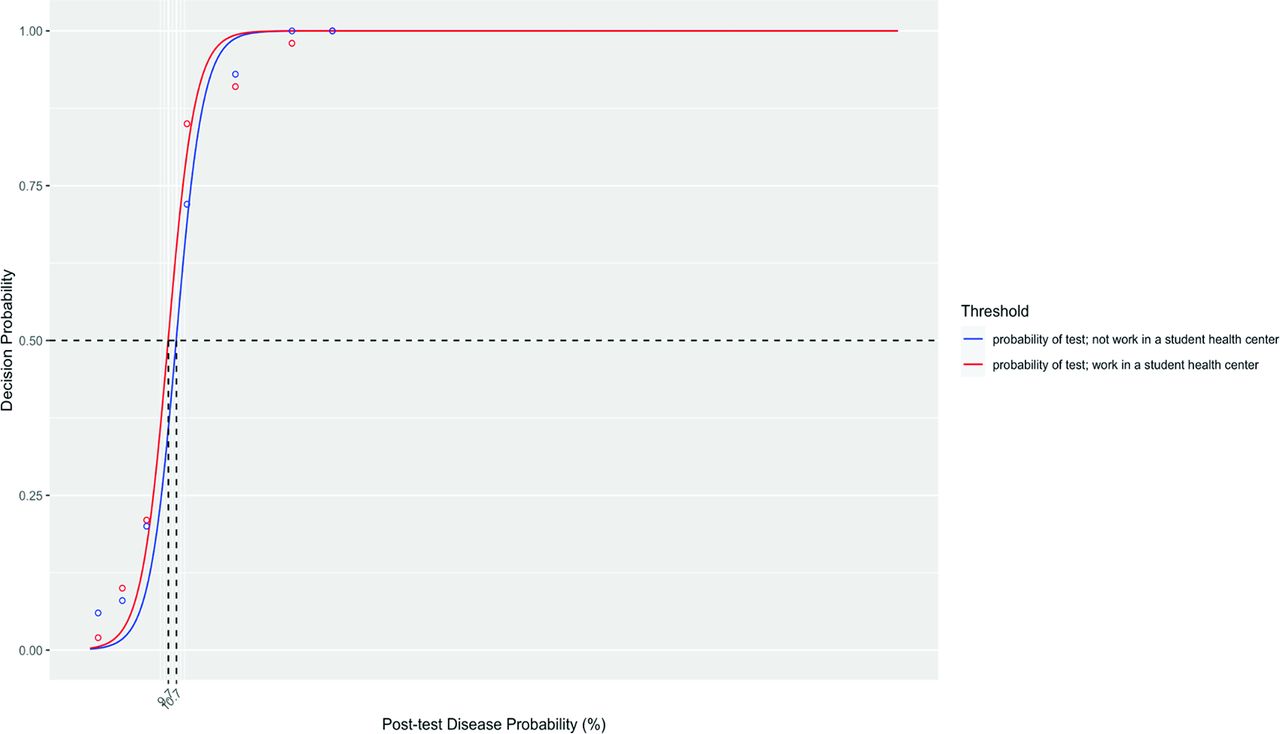
Test threshold by subgroups: working in a student health center versus not working in student health center.
Notes
This article was externally peer reviewed.
Funding: none.
Conflict of interest: none.
To see this article online, please go to: http://jabfm.org/content/35/6/1065.full.
- Received for publication April 29, 2021.
- Revision received July 14, 2022.
- Accepted for publication July 26, 2022.


