
Article Figures & Data
Figures
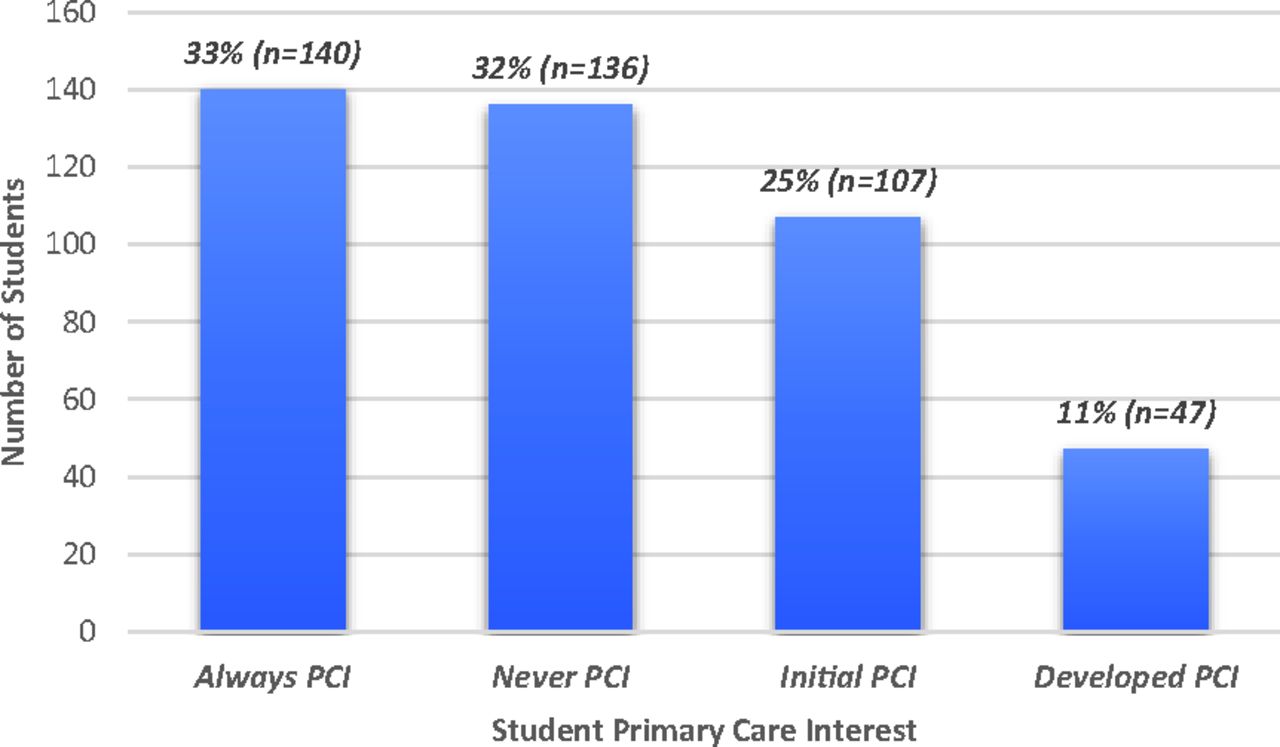
- Figure 1.
Proportions of students distributed among 4 groups based on their intention to practice primary care at matriculation and graduation (n = 430)
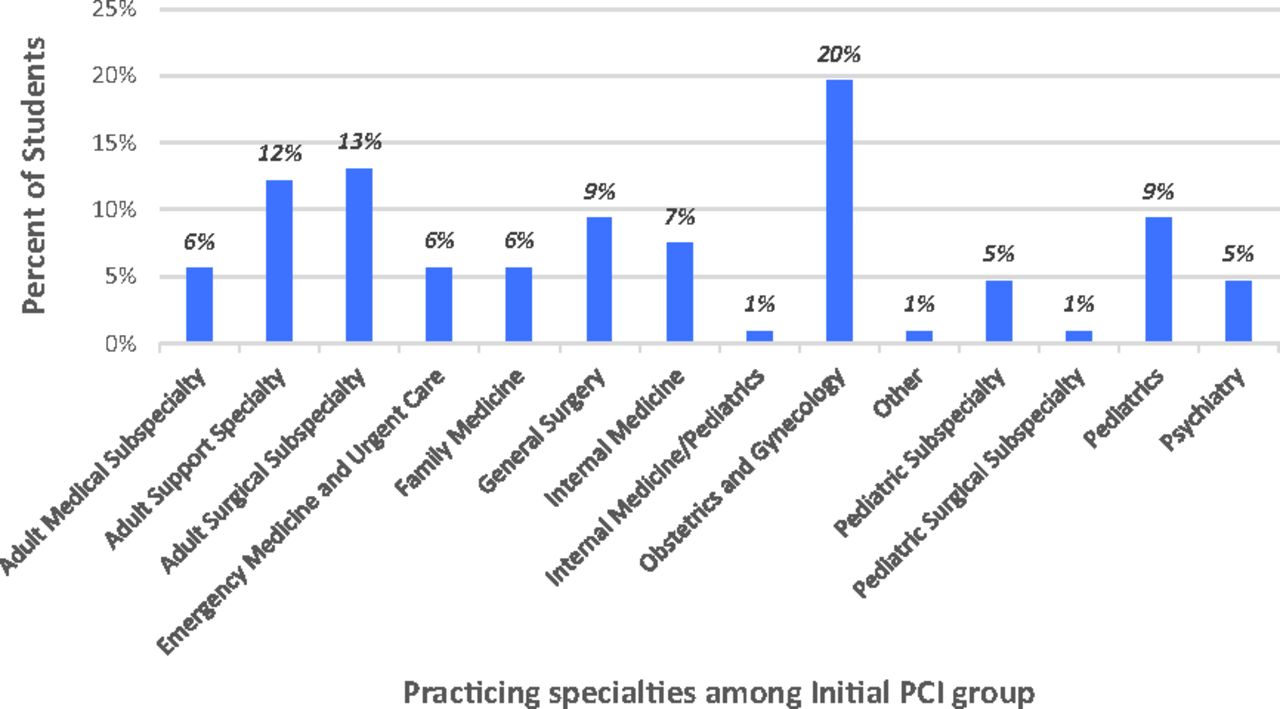
- Figure 2.
Percent of Michigan State University College of Human Medicine students practicing in each specialty that showed an interest in primary care (PCI) at matriculation but not graduation (Initial PCI group, n = 107).


Tables
- Table 1.
Coding Scheme Used to Indicate Primary Care Intention at Matriculation and Graduation, by Survey Year
Coding Year Variable Name Questionnaire Response Number MSQ PCI = 1 (YES) All SPEC_PREF “What general specialty are you considering?” FM (180), IM (200), Peds (500) GQ PCI = 1 (YES) 1978 to 1990 SPEC_PREF1 “If yes, which specialty are you planning?” FM (06), IM (07), Peds (19) SUB_SPEC_PLAN “Are you planning to become certified in a subspecialty?” No 1991 to 1998 SPEC_PREF1 “If yes, which specialty are you planning?” FM (06), IM (07), Peds (19) SPEC_PLAN “Are you planning to become certified in a specialty?” Yes SUB_SPEC_PLAN “Are you planning to become certified in a subspecialty?” No 1999 to 2004 SPEC_PREF1 “Which specialty are you planning?” FM (06), IM (07), Peds (19) SPEC_PLAN “Are you planning to become certified in a specialty?” Yes 2005 to 2010 (2008 was excluded) SPEC_PREF “Are you planning to become certified in a specialty or subspecialty? Choice of specialty/subspecialty” FM (120), IM (140), Peds (320) SPEC_PLAN “Are you planning to become certified in a specialty?” Yes Abbreviations: MSQ PCI, primary care intention at matriculation; GQ PCI, primary care intention at graduation; FM, Family Medicine; IM, Internal Medicine; Peds, Pediatrics. All other responses that were not indicated in this table were coded as 0.
- Table 2.
Descriptive Statistics and Response Rates of All MSU-CHM Students Graduating 1971–2010 (Original Cases) and the Subgroup of Those Students With Complete Responses to the Variables Used for This Study (Complete Cases) With Two-Sample Test for Equality of Proportions with Continuity Correction
Variables & Responses Total Original Cases (N1 = 2,047) Complete Cases (N2 = 430, 21%) Response Rates (%)  (df)
(df)P values N3 P SD N2 P SD Gender
Female2,047
1,080–
52%–
0.50430
222–
52%–
0.50100.00 0.14 (1) 0.712 Race/ethnicity
URM2,040
350–
17%–
0.38430
60–
14%–
0.3599.66 2.41 (1) 0.121 Geographic origin
Rural origin1,903
595–
31%–
0.46430
142–
33%–
0.4792.97 0.42 (1) 0.515 Practice specialty
PC1,535
620–
40%–
0.49430
197–
46%–
0.5074.99 3.85 (1) 0.050 MSQ PCI
Yes961
550–
57%–
0.49430
247–
57%–
0.5046.95 0.00 (1) 0.988 GQ PCI
Yes1,059
431–
41%–
0.49430
187–
43%–
0.5051.73 0.87 (1) 0.351 Initial PCI
Yes560
136–
24%–
0.43430
107–
25%–
0.4327.36 0.02 (1) 0.887 Developed PCI
Yes560
67–
12%–
0.32430
47–
11%–
0.3127.36 0.16 (1) 0.686 Never PCI
Yes560
182–
33%–
0.47430
136–
32%–
0.4727.36 0.05 (1) 0.824 Always PCI
Yes560
175–
31%–
0.46430
140–
33%–
0.4727.36 0.14 (1) 0.712 Abbreviations: Total original cases (N1 = 2,047), the number of samples making up the total sample size; Complete cases (N2 = 430) = the number of cases with responses to all variables used for this analyses; N3, the number of cases with responses to each variable (this number varies across the variables); P, proportions of each variable; SD, standard deviation of the proportion; Response rates, the number of people who completed the survey items divided by the number of people who make up the total sample size;
, the χ2 test for equality of proportions of each variables between N3 and N2 to evaluate the representativeness of the selected samples across variables; MSU-CHM, Michigan State University-College of Human Medicine; PC, primary care practice; Initial PCI, intention at matriculation-no intention at graduation; Developed PCI, no intention at matriculation-intention at graduation; Never PCI, no intention at matriculation-no intention at graduation; Always PCI, intention at matriculation-intention at graduation.
- Table 3.
Frequency and Proportion (%) of Primary Care Intention on Matriculating Student Questionnaire (MSQ) and Graduation Questionnaire (GQ) and Primary Care Practice, Across Demographic Variables With Chi-Square Test Results
DemographicCharacteristics Frequency (n = 430) Proportion (%) (df)P values MSQ PCI = 0 MSQ PCI = 1 MSQ PCI = 0 MSQ PCI = 1 MSQ PCI Male 101 107 23.5% 24.9% 5.466 (1) 0.019 Female 82 140 19.1% 32.6% Non-URM 156 214 36.3% 49.8% 0.074 (1) 0.786 URM 27 33 6.3% 7.7% Nonrural origin 119 169 27.7% 39.3% 0.405 (1) 0.525 Rural origin 64 78 14.9% 18.1% All students 183 247 42.6% 57.3% - GQ PCI = 0 GQ PCI = 1 GQ PCI = 0 GQ PCI = 1 GQ PCI Male 131 77 30.5% 17.9% 6.360 (1) 0.012 Female 112 110 26.0% 25.6% Non-URM 203 167 47.2% 38.8% 2.465 (1) 0.116 URM 40 20 9.3% 4.7% Nonrural origin 159 129 37.0% 30.0% 0.453 (1) 0.501 Rural origin 84 58 19.5% 13.5% All students 243 187 56.5% 43.5% - PC = 0 PC = 1 PC = 0 PC = 1 PC Male 129 79 30.0% 18.4% 9.356 (1) 0.002 Female 104 118 24.2% 27.4% Non-URM 200 170 46.5% 39.5% 0.000 (1) 1.000 URM 33 27 7.7% 6.3% Nonrural origin 152 136 35.3% 31.6% 0.536 (1) 0.464 Rural origin 81 61 18.8% 14.2% All students 233 197 54.2% 45.8% - Abbreviations: MSQ PCI, primary care intention at matriculation; GQ PCI, primary care intention at graduation; PC, primary care practice; 0, no, 1, yes.
Beta SE Wald df P values Odds Ratio (95% CI) Always PCI 4.606 0.431 10.691 1 < 0.001 100.08 (45.05–246.01) Developed PCI 4.094 0.505 8.102 1 < 0.001 59.98 (23.47–172.00) Initial PCI 1.355 0.404 3.357 1 < 0.001 3.88 (1.81–8.92) Female 0.498 0.290 1.717 1 0.086 1.64 (0.93–2.92) URM 0.627 0.401 1.566 1 0.117 1.87 (0.85–4.10) Rural origin −0.185 0.307 −0.601 1 0.548 0.83 (0.45–1.52) Abbreviations: SE, standard error; Always PCI, intention at matriculation-intention at graduation; Developed PCI, intention at matriculation-intention at graduation; Initial PCI, intention at matriculation-no intention at graduation; URM, underrepresented minority; CI, confidence interval.
Category Specialties Included Adult Medical Subspecialty Cardiology, Infectious Disease, Sleep Medicine, Neurology, Interventional Cardiology, Nephrology, Allergy and Immunology, Gastroenterology, Hematology/Oncology, Rheumatology, Cardiac Electrophysiology, Neuromuscular Medicine Adult Support Specialty Anesthesiology, Radiology, Pathology, Radiation Oncology, Forensic Pathology, Physical Medicine & Rehabilitation, Pulmonary Medicine and Critical Care, Pain Management, Radiation Oncology, Interventional Radiology, Anatomic Pathology Adult Surgical Subspecialty Ophthalmology, Dermatology, Thoracic Surgery, Plastic Surgery, Neurosurgery, Otolaryngology, Orthopedic Surgery, Vascular Surgery, Cardiothoracic Surgery, Urology, Hand Surgery, Colorectal Surgery, Trauma Surgery, Breast Surgery, Surgical Critical Care Pediatric Subspecialty Pediatric Neurology, Pediatric Infectious Disease, Pediatric Cardiology, Pediatric Hematology/Oncology, Pediatric Endocrinology, Adolescent Medicine, Neonatology, Pediatric Physical Medicine and Rehabilitation, Pediatric Nephrology, Pediatric Rheumatology, Pediatric Gastroenterology Pediatric Support Specialty Pediatric Anesthesiology, Pediatric Pulmonology, Pediatric Critical Care, Pediatric Radiology Pediatric Surgical Subspecialty Pediatric Orthopedic Surgery Other Occupational Medicine, Integrative Medicine, Clinical Genetics, Addiction Medicine


