
Abstract
Background: Lifestyle intervention decreases diabetes risk in prediabetic subjects, but the impact of passive notification of prediabetes status on glycemia or health behavior is unclear.
Methods: The Pathobiology of Prediabetes in a Biracial Cohort (POP-ABC) study followed normoglycemic African American (AA) and European American (EA) offspring of parents with type 2 diabetes mellitus for incident prediabetes. During 5.5 years of follow-up (mean, 2.62 years), 101 of 343 subjects developed prediabetes and were notified, without any interventions. Participants were recalled 18 months poststudy. Here, we compared data from participants with incident prediabetes or normoglycemia (control) during POP-ABC who underwent retesting 18-months poststudy.
Results: There were 73 subjects (46 female, 27 male; 36 AA, 37 EA) in the prediabetes group and 73 subjects (48 female, 25 male; 35 AA, 38 EA) in the control group. The mean (± SEM) enrollment age was 48.7 ± 0.96 years versus 48.3 ± 1.06 years (P = .37) and body mass index (BMI) was 31.1 ± 0.70 kg/m2 versus 29.2 ± 0.69 kg/m2 (P = .04) for prediabetes versus control groups, respectively. The 18-month changes (prediabetes vs control) were the following: fasting plasma glucose (FPG), −8.01 ± 1.11 vs 2.02 ± 0.64 mg/dL; 2-hour plasma glucose (2hrPG), −8.21 ± 3.34 vs 8.53 ± 3.17 mg/dL; weight, −0.54 ± 0.72 vs 2.77 ± 1.25 kg; and waist circumference −1.07 ± 0.78 vs 1.78 ± 0.85 (P = .03-<0.0001). The interval changes in FPG were significantly correlated with changes in weight and waist circumference (r = 0.2, P = .01). The prediabetes group reported improved dietary and exercise habits compared with control.
Conclusion: Communication of prediabetes status is associated with improvements in glucose tolerance, glycemia, and adiposity, probably via self-directed lifestyle modification.
The Department of Health and Human Services (HHS) and the American Diabetes Association (ADA) drew attention to prediabetes at a joint press conference: “HHS and the ADA are using the new term ‘prediabetes’ to describe an increasingly common condition in which blood glucose levels are higher than normal but not yet diabetic—known in medicine as impaired glucose tolerance (IGT) or impaired fasting glucose (IFG). Studies have shown that most people with this condition go on to develop type 2 diabetes within 10 years.”1 The Centers for Disease Control and Prevention estimates that 84.1 million US adults aged 18 years or older (∼34% of the adult US population) had prediabetes in 2015.2 Worldwide, more than 300 million people are estimated to have prediabetes.3
The diagnosis of prediabetes is established by the documentation of IFG, indicated by a fasting plasma glucose (FPG) level of 100 mg/dL to 125 mg/dL (5.6–6.9 mmol/L) or IGT, indicated by a 2-hour plasma glucose (2hrPG) level of 140 mg/dL to 199 mg/dL (7.8–11.0 mmol/L) during a 75-g oral glucose tolerance test (OGTT).4,5 Hemoglobin A1c (HbA1c) levels of 5.7–6.4% are also diagnostic of prediabetes.4 Besides the risk of developing type 2 diabetes mellitus (T2DM), people with prediabetes are at increased risks for heart disease, stroke, neuropathy, and other microvascular complications.6⇓–8
Several landmark clinical trials have demonstrated that lifestyle modification decreases blood glucose levels and prevents progression to T2DM in persons with prevalent prediabetes.9,12 In those studies, teams of dietitians, exercise physiologists, and other clinicians executed the standard lifestyle intervention protocols that led to the improvement in glucose tolerance and successful prevention of T2DM in study participants.9,11,13 Compared with the placebo group, individuals assigned to lifestyle intervention experienced 40–58% relative reduction in the risk of developing T2DM.9,11 Notably, the participants in the landmark diabetes prevention studies all had prevalent prediabetes determined during cross-sectional population screening and, therefore, of unknown duration at enrollment.9⇓–11
The impact of awareness of incident prediabetes status on glycemic trajectories among previously normoglycemic persons is unknown, and cross-sectional surveys show conflicting reports regarding the impact of such awareness on self-directed health behavior.14,15 The Pathobiology of Prediabetes in A Biracial Cohort (POP-ABC)16,17 study enrolled normoglycemic African American (AA) and European American (EA) offspring of parents with T2DM and followed them for the occurrence of incident prediabetes, defined as IFG and/or IGT.4,5 All POP-ABC study participants completed a screening OGTT before enrollment. The first subject was enrolled in September 2006, and the POP-ABC study ended in February 2012 after the final follow-up visits. During ∼5 years of follow-up, 101 of 343 subjects developed prediabetes and were duly notified, without any active intervention or counseling, as POP-ABC was a natural history study.
Eighteen months after the study ended, POP-ABC study participants were invited to return for OGTT and clinical examination, as part of the screening procedures for a newly funded Pathobiology and Reversibility of Prediabetes in A Biracial Cohort (PROP-ABC) study, whose aims include intensive lifestyle intervention to reverse prediabetes (ClinicalTrials.gov Identifier NCT02027571). Here, we report temporal changes in glucose and other metabolic measures between the end of POP-ABC and the beginning of PROP-ABC (18 months later) in participants with incident prediabetes during POP-ABC (pre-diabetes mellitus group) compared with a matched group of POP-ABC participants who did not develop prediabetes.
Methods
Study Subjects
The study subjects were participants in the POP-ABC study.16,17 Eligibility criteria for the POP-ABC study included age 18 to 65 years, self-reported non-Hispanic white (EA) or non-Hispanic black (AA) race/ethnicity status; 1 or both biological ]parents with T2DM; no evidence of diabetes; normal FPG (<100 mg/dL [<5.6 mmol/L]) and/or normal 2hrPG (<140 mg/dL [<7.8 mmol/L]) during a 75-g OGTT; and good overall health, as previously described.16,17 None of the participants was using any medications known to alter glucose or lipid metabolism. Enrollment in behavioral, pharmacologic, or other active weight loss program or a history of liposuction or bariatric surgery were additional exclusion criteria.16,17 The primary outcome was the occurrence of prediabetes (IFG and/or IGT) or diabetes, defined by the ADA criteria.4 A confirmatory test was performed within 6 weeks of each endpoint occurrence. The 75-g OGTT was the method of confirmation. All endpoints were independently adjudicated by the Institutional Data and Safety Officer (Murray Heimberg, MD, PhD). The study protocols were approved by the University of Tennessee Institutional Review Board; all participants gave written informed consent before initiation of study procedures.
Chronology and Outcome
The first subject was enrolled in September 2006 and the POP-ABC study ended in February 2012 after the final follow-up visits.16,17 During 5.5 years of follow-up (mean, 2.62 years), 101 of 343 participants developed incident prediabetes.17 Per the study protocol, a copy of the confirmatory OGTT result was provided to all participants reaching the endpoint. However, no intervention or counseling was provided, as POP-ABC was a purely natural history study. In September 2013, 18 months after close-out of the POP-ABC study, funding became available for a continuation study, the PROP-ABC, whose goal is to provide intensive lifestyle intervention to the POP-ABC participants with incident prediabetes (ClinicalTrials.gov Identifier NCT02027571). Eligibility for PROP-ABC thus was limited to the original POP-ABC participants, all of whom were invited to join the new study. Interested participants underwent a standard OGTT, anthropometry, and clinical examination, as part of the baseline reenrollment procedures. To test the hypothesis that awareness of incident prediabetes status triggers self-directed health behaviors that improve metabolic endpoints, we compared the temporal trends in OGTT, anthropometric, and lipid data between the end of POP-ABC and the initiation of PROP-ABC study in participants with incident prediabetes during the POP-ABC phase and an age-, sex-, and ethnicity-matched control group. We also compared changes in self-reported dietary and physical activity behaviors between the 2 groups of participants.
Figure 1 summarizes the time intervals from the beginning until the end of the POP-ABC study to rescreening for the extension PROP-ABC study.
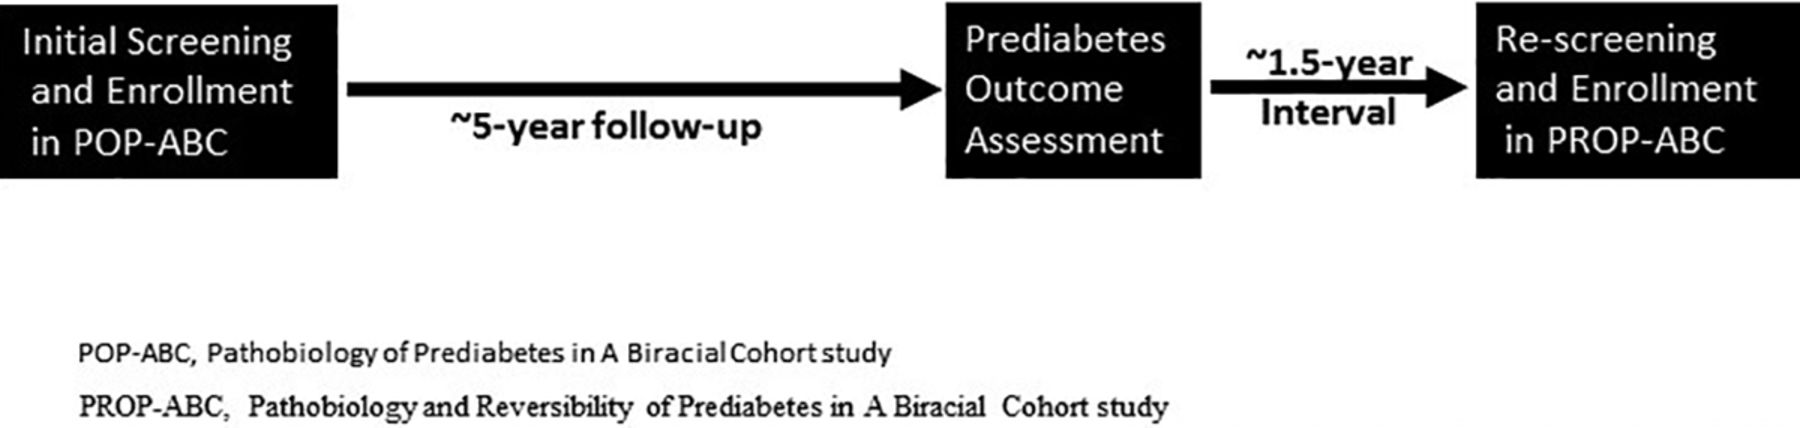
Study design and time intervals of data collection. Prediabetes outcome was assessed after ∼5 years of follow-up of initially normoglycemic POP-ABC participants. Eighteen months later, POP-ABC study participants were rescreened for a newly funded extension PROP-ABC study. The present report compares the 18-month interval changes in glycemic and other measurements between participants who developed prediabetes during POP-ABC study and those who remained normoglycemic.
Assessments
Participants arrived at the University of Tennessee General Clinical Research Center after an overnight fast to undergo physical examination and scheduled assessments. Height was recorded using a stadiometer, weight was measured with a digital scale (Tanita WB-300 Plus Digital, Arlington Heights, IL), and body mass index (BMI) was calculated as weight (kg) divided by the square of the height in meters. A Gulick II tape was used to measure waist circumference, as previously described.16,17 Usual food intake was captured using the Food Habits Questionnaire (FHQ)18 and habitual physical activity was recorded using the Modifiable Activity Questionnaire (MAQ),19 as previously described.20 The responses to the MAQ were converted to metabolic equivalent (MET) based on the intensity of the reported activities and expressed as MET-hours/week.20 A standard OGTT was initiated between 0700 and 1100: venous blood specimens for glucose and insulin measurement were obtained before (0 minutes) and at 30 minutes and 120 minutes after ingestion of 75 g flavored glucose (Trutol 75; Custom Laboratories, Baltimore, MD).
Biochemical Measurements
Plasma glucose was measured with a glucose oxidase method (Yellow Spring Instruments Co., Inc., Yellow Spring, OH). Plasma insulin levels were measured immunochemically in our Endocrine Research Laboratory, using commercial enzyme-linked immunosorbent assay kits. HbA1c and fasting plasma lipid profiles were measured in a contract clinical laboratory.
Statistical Analysis
Data were reported as means ± SEM. Differences between defined groups were analyzed using unpaired t tests for continuous variables and χ2 test for categoric variables. Interval changes in glycemic, anthropometric, and behavioral measures between the 2 defined testing periods were analyzed using paired t tests. General linear regression models were used to analyze the relationship between temporal changes in anthropometric and metabolic variables. All statistical analyses were performed with the use of SAS statistical software, version 9.3 (SAS Institute Inc., Cary, NC).
Results
Cohort Description
The characteristics at enrollment of study subjects who developed prediabetes and were so informed during POP-ABC and age- and sex-matched participants who maintained normoglycemia during POP-ABC study (control) are shown in Table 1. As previously reported,17 participants who developed incident prediabetes had higher BMI, waist circumference, FPG, and 2hrPG at enrollment, compared with participants who maintained normoglycemia.
Baseline Characteristics of Pathobiology of Prediabetes in a Biracial Cohort Study Participants Who Subsequently Developed Incident Prediabetes or Maintained Normoglycemia (Control) during ∼5 Years of Follow-up*
Glycemic, Anthropometric, and Lipidmic Changes
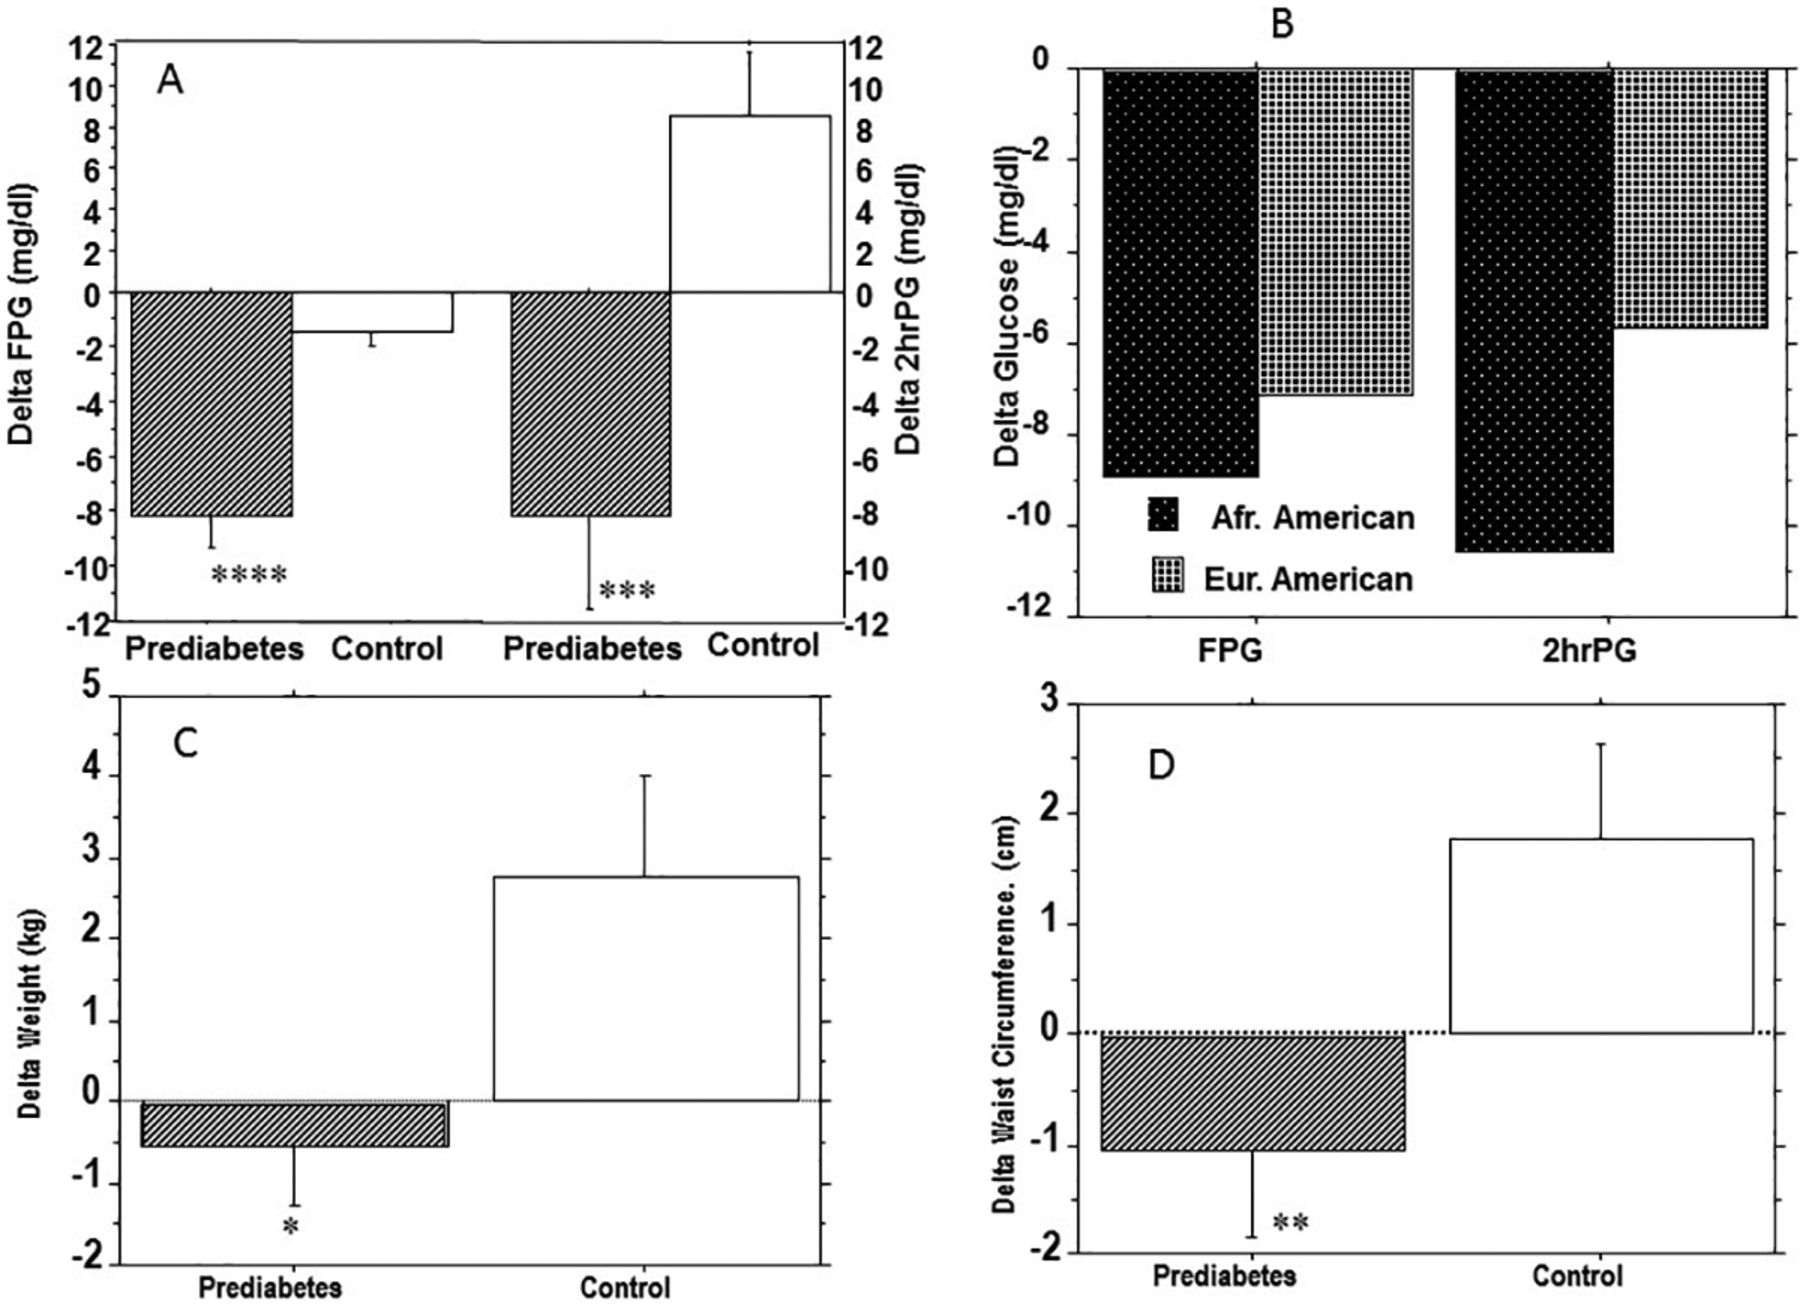
We assessed the interval changes in plasma glucose and other metabolic endpoints when progressors and nonprogressors to prediabetes during POP-ABC study were rescreened for enrollment in the extension study (PROP-ABC). As already noted, the POP-ABC study was an observational, natural history study that did not entail any drug intervention or lifestyle counseling to alter metabolic endpoints. During the 18-month interval between the end of POP-ABC study and rescreening for the PROP-ABC study, FPG levels decreased by 8.01 ± 1.11 mg/dL in the prediabetes group and by 2.02 ± 0.64 mg/dL in the control group (P < .0001). During the same said interval, 2hrPG levels decreased by 8.21 ± 3.34 mg/dL in the prediabetes group but increased by 8.53 ± 3.17 mg/dL in the control group (P = .0004) (Figure 2 and Table 2). The corresponding interval changes (prediabetes group vs control group) were −0.54 ± 0.72 kg versus 2.77 ± 1.25 kg (P = .006) for body weight and −1.07 ± 0.78 cm versus 1.78 ± 0.85 cm (P = .001) for waist circumference (Figure 2 and Table 2). The change in BMI was 0.23 ± 0.29 kg/m2 in the prediabetes group and 1.06 ± 0.46 kg/m2 in control (P = .03). In the regression analyses, the interval changes in FPG were correlated with interval changes in weight (r = 0.18, P = .04) and waist circumference (r = 0.20, P = .01).

Interval changes in glycemia in prediabetes and control groups (A) and within the prediabetes group by ethnicity (B), and interval changes in weight (C) and waist circumference (D) in the prediabetes and control groups. There were no significant ethnic differences in the interval changes in glycemia. *P = .006, **P = .001, ***P = .0004, ****P < .0001. To convert the values for glucose to millimoles per liter, multiply by 0.0555. FPG, fasting plasma glucose; PG, plasma glucose.
Interval Changes in Glycemic, Anthropometric and Behavioral Measures in Subjects with Incident Prediabetes or Normoglycemia (Control)*
The prediabetes group did not show significant alterations in plasma levels of low-density lipoprotein cholesterol (111 ± 3.61 mg/dL vs 111 ± 3.79 mg/dL), high-density lipoprotein cholesterol (49.2 ± 2.18 mg/dL vs 50.5 ± 1.65 mg/dL), or triglycerides (106 ± 6.71 mg/dL vs 102 ± 5.33 mg/dL) between the end of POP-ABC versus follow-up examination 18 months later, nor did the control group: low-density lipoprotein cholesterol, 106 ± 3.55 mg/dL versus 106 ± 3.31 mg/dL; high-density lipoprotein cholesterol, 54.7 ± 1.73 mg/dL versus 55.1 ± 1.57 mg/dL; and triglycerides, 91.5 ± 5.85 versus 94.2 ± 4.91.
Behavioral Changes
Self-reported FHQ score (lower values indicate healthier eating pattern) decreased from 2.57 ± 0.51 to 2.34 ± 0.55 (−0.23; P = .0003) in the prediabetes group and from 2.51 ± 0.50 to 2.35 ± 0.52 (−0.16; P = .0005) in the control group. The absolute decrease in FHQ score was significantly greater in the prediabetes group versus control group (−0.23 ± 0.05 vs −0.16 ± 0.04, P = .002). Self-reported MAQ score (higher values indicate greater physical activity) increased nominally from 13.8 ± 3.03 MET-hr/wk to 16.5 ± 2.47 MET-hr/wk in the prediabetes group, but decreased nominally from 21.7 ± 3.39 MET-hr/wk to 18.4 ± 2.76 MET-hr/wk in the control group. The absolute change in MAQ score was significantly greater in the prediabetes group versus control group (2.70 ± 3.45 MET-hr/wk vs −3.30 ± 4.20 MET-hr/wk; P = .002) (Table 2).
Discussion
In the present report, we observed that POP-ABC participants who were notified that they had developed incident prediabetes showed decreases in FPG and 2hrPG levels, weight, and waist circumference when reassessed 18 months later. These improvements were in comparison with a control group of age-, sex-, and ethnicity-matched POP-ABC participants who had maintained normoglycemia during the same follow-up period. The POP-ABC study was a longitudinal natural history study of the transition from normal glucose regulation to prediabetes among initially normoglycemic AA and EA adults who have 1 or both biological parents with diagnosed T2DM.16,17 By design, no therapeutic intervention was offered to the participants who progressed to prediabetes. However, a written report of the confirmatory OGTT results indicating the development of IFG and/or IGT was provided to participants reaching those endpoints. Thus, our present findings suggest that the mere notification of incident prediabetes status may trigger beneficial changes in glycemia and body size in AAs and EAs with parental history of T2DM.
The mechanism(s) for the observed benefits in glycemia, glucose tolerance, and adiposity following notification of incident prediabetes status are unclear but could have involved self-directed lifestyle modification. To explore such a mechanism, we analyzed changes in self-reported dietary and physical activity behaviors in the 2 comparison groups of participants across the 18-month interval between conclusion of the POP-ABC study and initiation of the PROP-ABC study. We found that FHQ scores decreased in both the prediabetes and control groups (indicating healthier eating patterns), but the improvement was significantly greater in the prediabetes group. Similarly, participants in the prediabetes group reported a significant 6 MET-hr/wk greater physical activity than did those in the control group. These behavioral alterations, if sustained, could explain the glycemic and weight benefits observed in the prediabetes group. In addition to self-directed behavioral changes, it is possible that some participants may have discussed their prediabetes status with their primary care providers and may have received lifestyle counseling outside our study.
Did the Hawthorne effect or regression to the mean play a role in our findings? Subjects enrolled in research studies may alter their behavior and produce unintended results, from the increased attention and encounters associated with research participation (Hawthorne effect).21 Usually, the Hawthorne effect dissipates within approximately 4 months or once study procedures cease.22,23 Notably, our POP-ABC study had a follow-up period of 5.5 years (mean, 2.62 years) and the interval between end of study and retesting of participants was 18 months. Thus, it is unlikely that our present findings could be explained by the Hawthorne effect. Moreover, there is no reason why any Hawthorne effect would be restricted to the prediabetes group. The statistical phenomenon of regression to the mean describes the tendency of individuals with outlier values on a given measure to have spontaneously lower values on retesting, without any intervention. The use of contemporaneous measurements in a matched control group, as was done in the present study, usually obviates the risk of misinterpretation due to regression to the mean.24,25
Two previous national surveys had reported discordant findings on the impact of awareness of prediabetes status on health behavior.14,15 Data from the 2006 National Health Interview Survey showed that of the ∼ 4% of US adults who had been told that they had prediabetes, 68% reported active attempts to lose or control weight, 55% reported increased physical activity, 60% reported less fat consumption, and 42% reported trying all 3 approaches.14 In a different report, investigators analyzed data on 24-hour dietary recall, self-reported diabetes and prediabetes awareness status, and FPG and HbA1c values from the 2005 to 2010 National Health and Nutrition Examination Survey.15 Persons unaware of diabetes and prediabetes were identified by FPG <126 mg/dL or HbA1c <6.5% and FPG 100 mg/dL to 125 mg/dL or HbA1c of 5.7–6.4%, respectively.15 People with diagnosed diabetes reported consumption of less carbohydrates and more protein compared with those with undiagnosed diabetes.15 However, the authors observed no significant differences in macronutrient intake by awareness of prediabetes status.15 The conclusion from the 2005 to 2010 National Health and Nutrition Examination Survey data was that knowledge of glycemic status induced healthier dietary patterns for people with diabetes but not those with prediabetes. Unlike the cross-sectional surveys based on self-reported prediabetes status, our prospective study used a rigorous ascertainment of incident prediabetes status, using OGTT and independent adjudication. Thus, the mechanism of becoming aware of incident prediabetes in the POP-ABC study was the documentation that a participant's FPG and/or 2hrPG values had drifted upward from normal glucose regulation to prediabetes (IFG and/or IGT). Our findings support a beneficial impact of prediabetes awareness on health behavior and metabolic endpoints. We argue that awareness of incident prediabetes status through direct communication of measured glucose values, as was done in the POP-ABC study, was impactful in triggering behavioral change.
Remarkably, the vast majority of people with prediabetes in the general primary care population remain undiagnosed and unaware of their condition.2,14,15,26 In the 2006 National Health Interview Survey, only an estimated 4% of US adults had been told they had prediabetes.15 Although ∼34% of US adults had prediabetes in 2015, only 11.6% self-reported that they had been diagnosed with prediabetes by a health care worker.2 Awareness of and response to prediabetes among health care providers is even much lower. Analyzing HbA1c data from the 2012 National Ambulatory Medical Care Survey that targeted adults aged >45 years without diagnosed diabetes who had an HbA1c test within 90 days (N = 11,167,004 weighted visits), the prevalence of prediabetes was found to be 33.6%.26 However, <1% of patients with HbA1c results consistent with prediabetes had formal diagnosis and documentation of prediabetes in the medical records.26 Clearly, there is need for a greater awareness and early action regarding the diagnosis and management of prediabetes. Once a diagnosis is obtained, using FPG, OGTT, or HbA1c values, the clinical significance of prediabetes needs to be communicated clearly to all affected patients (6 to 8), as the present report has shown that notification of prediabetes status (even without active intervention) may trigger beneficial self-directed lifestyle modifications. In addition, current guidelines by the ADA recommend referring people with prediabetes for intensive lifestyle modification.4
Acknowledgments
All authors participated in the interpretation of the studies and review of the manuscript. SD-J, as principal investigator and guarantor of this manuscript, designed the study, analyzed data, and wrote the manuscript. IO performed statistical analysis, reviewed, and revised manuscript; and NU collected data, reviewed, and revised the manuscript. FC collected data, reviewed, and revised the manuscript.
We are indebted to the participants who volunteered for this study.
Notes
This article was externally peer reviewed.
Funding: This study was supported by Grant R01 DK067269 from the National Institutes of Health and Grant 7–07-MN-13 from the ADA, both awarded to SD-J. The funding sources had no role in the design and execution of the study, or analysis and publication of the data obtained from the study.
Conflict of interest: none declared.
To see this article online, please go to: http://jabfm.org/content/32/1/20.full.
- Received for publication August 21, 2018.
- Revision received September 27, 2018.
- Accepted for publication October 2, 2018.
References
In this issue


Jump to section
Related Articles
Cited By...
- Association of physical activity and sedentary behavior with type 2 diabetes and glycemic traits: a two-sample Mendelian randomization study
- Turning Points as Opportunities to Partner with Patients Living with type 2 Diabetes or Prediabetes
- Designing and Evaluating a Prediabetes Shared Decision Aid
- Conversations, Communication and Counseling Are Key Family Medicine Tactics to Improve Patient Health