
Article Figures & Data
Figures
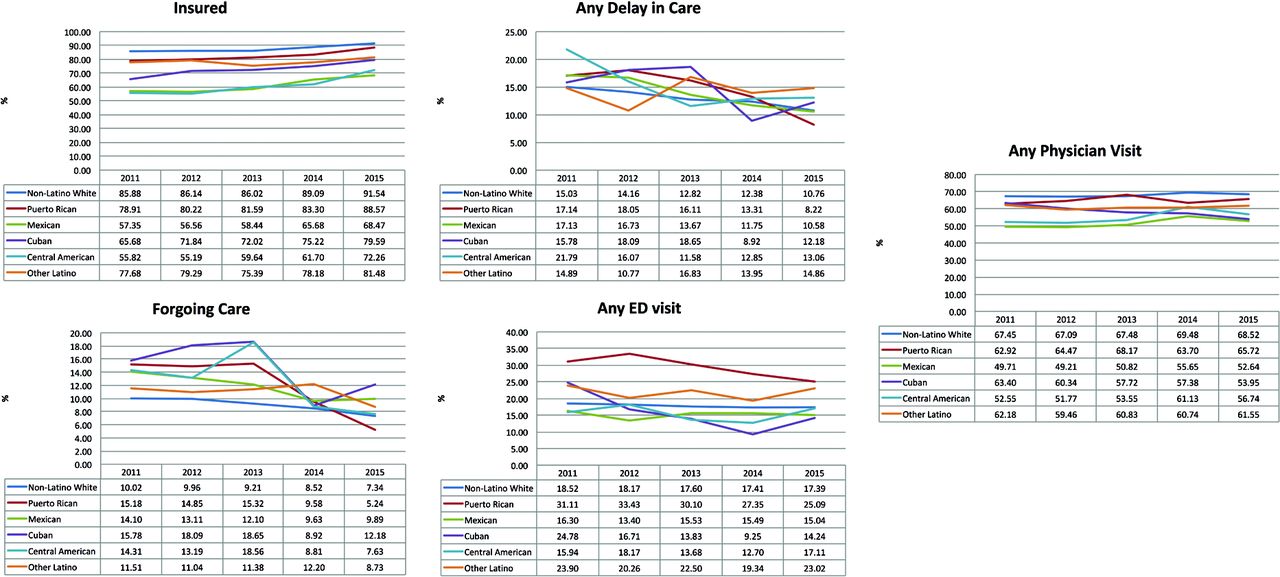
- Figure 1.
Rates of access and utilization measures, by heritage group. Data from the 2011 to 2015 National Health Interview Survey (N = 86,467).

Tables
- Table 1.
Sample Characteristics, by Heritage Group, 2011 to 2015 National Health Interview Survey (N = 86,467)
Total (n = 86,467) Non-Latino White (n = 65,703) Puerto Rican (n = 1,995) Mexican (n = 12,983) Cuban (n = 871) Central American (n = 3,592) Other Latino (n = 1,323) P Value n % n % n % n % n % n % n % Year .304 2011 16,632 19.24 12,506 19.03 391 19.60 2,561 19.73 178 20.44 721 20.07 275 20.79 2012 17,325 20.04 13,153 20.02 395 19.80 2,648 20.40 169 19.40 705 19.63 255 19.27 2013 17,036 19.70 12,882 19.61 401 20.10 2,592 19.96 188 21.58 708 19.71 265 20.03 2014 18,656 21.58 14,285 21.74 412 20.65 2,736 21.07 192 22.04 752 20.94 279 21.09 2015 16,818 19.45 12,877 19.60 396 19.85 2,446 18.84 144 16.53 706 19.65 249 18.82 Citizenship status <.001 US-born 71,176 82.32 62,683 95.40 1,151 57.69 5,836 44.95 269 30.88 587 16.34 650 49.13 Naturalized 6,492 7.51 1,949 2.97 813 40.75 1,899 14.63 317 36.39 1,125 31.32 389 29.40 Non–US citizen 8,799 10.18 1,071 1.63 31 1.55 5,248 40.42 285 32.72 1,880 52.34 284 21.47 Interview language <.001 English 81,206 93.92 65,574 99.80 1,841 92.28 9,843 75.81 473 54.31 2,436 67.82 1,039 78.53 Spanish 5,151 5.96 38 0.06 153 7.67 3,131 24.12 396 45.46 1,149 31.99 284 21.47 Other 110 0.13 91 0.14 1 0.05 9 0.07 2 0.23 7 0.19 0 0.00 Age (years) <.001 18–24 9,794 11.33 6,828 10.39 274 13.73 2,004 15.44 80 9.18 451 12.56 157 11.87 25–34 18,736 21.67 13,384 20.37 478 23.96 3,441 26.50 158 18.14 964 26.84 311 23.51 35–44 18,638 21.56 13,136 19.99 468 23.46 3,564 27.45 210 24.11 980 27.28 280 21.16 45–54 19,301 22.32 15,207 23.15 412 20.65 2,387 18.39 250 28.70 731 20.35 314 23.73 55–64 19,998 23.13 17,148 26.10 363 18.20 1,587 12.22 173 19.86 466 12.97 261 19.73 Female sex 45,998 53.20 34,556 52.59 1,189 59.60 7,047 54.28 451 51.78 1,959 54.54 796 60.17 <.001 Married 44,919 51.95 34,401 52.36 710 35.59 7,002 53.93 435 49.94 1,849 51.48 522 39.46 <.001 Family income <.001 <100% FPL 14,647 16.94 8,672 13.20 664 33.28 3,796 29.24 204 23.42 912 25.39 399 30.16 100–200% FPL 15,534 17.97 9,536 14.51 430 21.55 3,980 30.66 210 24.11 1,057 29.43 321 24.26 >200% FPL 56,286 65.10 47,495 72.29 901 45.16 5,207 40.11 457 52.47 1,623 45.18 603 45.58 Education <.001 Less than high school 11,520 13.32 4,400 6.70 474 23.76 5,108 39.34 103 11.83 1,133 31.54 302 22.83 High school 20,410 23.60 15,027 22.87 566 28.37 3,410 26.27 282 32.38 806 22.44 319 24.11 Some college education 17,496 20.23 13,900 21.16 400 20.05 2,187 16.85 110 12.63 613 17.07 286 21.62 College degree 27,919 32.29 24,053 36.61 458 22.96 1,934 14.90 302 34.67 826 23.00 346 26.15 More than college degree 9,122 10.55 8,323 12.67 97 4.86 344 2.65 74 8.50 214 5.96 70 5.29 US Census region <.001 Northeast 13,989 16.18 11,211 17.06 1,051 52.68 312 2.40 51 5.86 788 21.94 576 43.54 Midwest 19,662 22.74 17,808 27.10 195 9.77 1,386 10.68 24 2.76 188 5.23 61 4.61 South 28,387 32.83 21,104 32.12 567 28.42 4,168 32.10 733 84.16 1,544 42.98 271 20.48 West 24,429 28.25 15,580 23.71 182 9.12 7,117 54.82 63 7.23 1,072 29.84 415 31.37 Self-reported health status <.001 Excellent 25,933 29.99 20,164 30.69 474 23.76 3,420 26.34 339 38.92 1,138 31.68 398 30.08 Very good 28,818 33.33 23,012 35.02 547 27.42 3,607 27.78 240 27.55 1,046 29.12 366 27.66 Good 21,582 24.96 15,290 23.27 558 27.97 4,174 32.15 170 19.52 1,048 29.18 342 25.85 Fair 7,776 8.99 5,430 8.26 318 15.94 1,468 11.31 95 10.91 306 8.52 159 12.02 Poor 2,358 2.73 1,807 2.75 98 4.91 314 2.42 27 3.10 54 1.50 58 4.38 Chronic conditions Hypertension 20,223 23.39 16,374 24.92 470 23.56 2,339 18.02 203 23.31 516 14.37 321 24.26 <.001 Coronary heart disease 2,093 2.42 1,749 2.66 60 3.01 184 1.42 22 2.53 48 1.34 30 2.27 <.001 Heart condition/disease 4,853 5.61 4,223 6.43 113 5.66 349 2.69 32 3.67 81 2.26 55 4.16 <.001 Asthma 11,190 12.94 9,038 13.76 480 24.06 1,089 8.39 113 12.97 296 8.24 174 13.15 <.001 Cancer 5,125 5.93 4,639 7.06 82 4.11 277 2.13 18 2.07 64 1.78 45 3.40 <.001 Diabetes 5,914 6.84 4,266 6.49 208 10.43 1,093 8.42 55 6.31 175 4.87 117 8.84 <.001 Any functional limitation 26,012 30.08 21,145 32.18 715 35.84 2,958 22.78 163 18.71 654 18.21 377 28.50 <.001 FPL, federal poverty level.
- Table 2.
Odds of Access and Utilization of Health Care as a Function of Year, Heritage Group, Citizenship Status, and Interview Language, 2011 to 2015 National Health Interview Survey (N = 86,467)
Insured Delay in Care Forgo Care ED Use Physician Visit OR 95% CI OR 95% CI OR 95% CI OR 95% CI OR 95% CI Year 2011 2012 1.03 0.96–1.10 0.91 0.85–0.98 0.97 0.90–1.05 0.96 0.89–1.03 0.97 0.92–1.03 2013 1.02 0.95–1.10 0.81* 0.75–0.87 0.90† 0.82–0.98 0.95 0.89–1.02 1.01 0.96–1.07 2014 1.43* 1.32–1.55 0.75* 0.69–0.81 0.77* 0.70–0.85 0.92† 0.86–0.99 1.13* 1.06–1.20 2015 1.82* 1.68–1.98 0.63* 0.58–0.69 0.67* 0.61–0.73 0.93 0.86–1.01 1.03 0.97–1.09 Heritage group Non-Latino white Puerto Rican 1.05 0.90–1.22 0.86 0.72–1.03 0.94 0.78–1.14 1.42* 1.24–1.63 0.90 0.79–1.02 Mexican 0.68* 0.63–0.73 0.83* 0.77–0.91 0.96 0.87–1.06 0.83* 0.77–0.91 0.87* 0.82–0.93 Cuban 0.98 0.75–1.29 1.08 0.88–1.34 1.33† 1.02–1.73 1.15 0.88–1.51 0.96 0.82–1.13 Central American 0.66* 0.59–0.74 1.08 0.94–1.24 1.28* 1.10–1.49 1.07 0.94–1.22 1.01 0.91–1.11 Other Latinos 1.01 0.84–1.22 0.92 0.75–1.13 0.99 0.79–1.24 1.25† 1.07–1.46 0.90 0.78–1.02 Citizenship status US-born Naturalized 0.86* 0.78–0.95 0.96 0.86–1.07 1.03 0.90–1.17 0.92 0.83–1.01 1.09† 1.01–1.17 Non–US citizen 0.34* 0.31–0.37 1.10 0.99–1.24 1.12 1.00–1.26 0.78* 0.69–0.88 0.74* 0.68–0.80 Interview language English Spanish 0.79* 0.71–0.87 1.05 0.93–1.18 0.86† 0.75–0.98 0.62* 0.55–0.71 0.80* 0.74–0.87 Other 0.55† 0.31–0.98 0.61 0.29–1.31 0.53 0.27–1.04 0.80 0.35–1.82 0.80 0.55–1.17 - Table 3.
Odds of Access and Utilization of Health Care as a Function of Year and Heritage Group Interaction Citizenship, 2011 to 2015 National Health Interview Survey (N = 86,467)
Insured Delay in Care Forgo Care ED Use Physician Visit OR 95% CI OR 95% CI OR 95% CI OR 95% CI OR 95% CI Heritage Non-Latino white Puerto Rican 1.05 0.88–1.26 0.97 0.78–1.19 1.16 0.93–1.44 1.59* 1.36–1.85 0.94 0.81–1.09 Mexican 0.67* 0.62–0.73 0.89† 0.81–0.98 1.00 0.89–1.12 0.81* 0.74–0.89 0.85* 0.79–0.91 Cuban 0.91 0.71–1.17 1.22 0.94–1.58 1.52† 1.10–2.10 1.32† 1.05–1.65 1.01 0.83–1.22 Central American 0.63* 0.55–0.72 1.10 0.93–1.29 1.35* 1.14–1.60 1.10 0.94–1.28 0.92 0.81–1.04 Other Latinos 1.14 0.90–1.43 0.82 0.63–1.07 0.92 0.70–1.20 1.25† 1.04–1.50 0.91 0.76–1.08 Time period Before ACA After ACA 1.56* 1.46–1.67 0.78* 0.74–0.84 0.78* 0.72–0.84 0.96 0.91–1.01 1.07* 1.02–1.12 Heritage group × time period White × after ACA Puerto Rican × after ACA 0.98 0.72–1.32 0.71† 0.52–0.98 0.53* 0.35–0.79 0.76† 0.60–0.97 0.88 0.70–1.11 Mexican × after ACA 1.03 0.92–1.16 0.82† 0.71–0.95 0.90 0.76–1.06 1.07 0.94–1.22 1.07 0.97–1.17 Cuban × after ACA 1.21 0.85–1.73 0.70 0.43–1.15 0.64 0.39–1.06 0.67 0.38–1.17 0.90 0.70–1.17 Central American × after ACA 1.15 0.94–1.40 0.94 0.74–1.21 0.86 0.65–1.14 0.94 0.74–1.20 1.25† 1.04–1.49 Other Latino × after ACA 0.73 0.54–1.00 1.32 0.86–2.04 1.22 0.78–1.90 1.01 0.75–1.34 0.97 0.73–1.30 Models also control for citizenship status, interview language, age, sex, marital status, family income, education, US Census region, self-reported health status, chronic conditions, and functional limitations.
↵* P < .01.
↵† P < .05.
ACA, Patient Protection and Affordable Care Act; CI, confidence interval; OR, odds ratio.
- Table 4.
Odds of Access and Utilization of Health Care as a Function of Year and Citizenship Status or Interview Language Interactions, 2011 to 2015 National Health Interview Survey
Outcome Insured Delay in Care Forgo Care ED Use Physician Visit OR 95% CI OR 95% CI OR 95% CI OR 95% CI OR 95% CI Citizenship × time period* (n = 20,764) US-born × after ACA Naturalized × after ACA 0.98 0.82–1.17 1.05 0.83–1.32 1.09 0.84–1.40 1.02 0.84–1.24 1.10 0.94–1.28 Non–US citizen × after ACA 1.03 0.81–1.30 0.80 0.62–1.03 0.83 0.62–1.12 0.94 0.76–1.16 1.15 0.96–1.36 Interview language × time period† (n = 20,745) English × after ACA Spanish × after ACA 1.02 0.87–1.20 0.97 0.79–1.19 0.92 0.74–1.14 0.96 0.76–1.22 1.17‡ 1.01–1.37 ↵* Models also control for race, interview language, age, sex, marital status, family income, education, US Census region, self-reported health status, chronic conditions, and functional limitations.
↵† Models also control for race, citizenship, age, sex, marital status, family income, education, US Census region, self-reported health status, chronic conditions, and functional limitations. These analyses excluded individuals who completed the National Health Interview Survey in a language other than English or Spanish.
↵‡ P < .05.
ACA, Patient Protection and Affordable Care Act; CI, confidence interval; ED, emergency department; OR, odds ratio.
In this issue


Jump to section
Related Articles
Cited By...
- Racial and ethnic differences in the availability of community medical services after leaving prison
- Community-Based Health Care Navigation's Impact on Access to Primary Care for Low-Income Latinos
- National Trends and Disparities in Hospitalization for Hypertensive Emergencies Among Medicare Beneficiaries, 1999-2019
- A Meta-Analysis of Mental Health among Latino Adults: Elucidating Disparities from Differences
- Content Usage and the Most Frequently Read Articles of 2017
- Practice Innovation for Care Integration, Opioid Management, and Quality Measurement in Family Medicine