
Abstract
Background: Responding to quality metrics is an accepted and expected component of the current health care environment. Little is known about which measures physicians identify as a priority when reporting the quality of care to their patients, especially the care of children in rural settings. The objective of this study is for physicians caring for children in rural communities to identify which of the initial core sets of 24 child health quality measures are useful and are a priority for reporting and improving care.
Methods: A survey was sent to rural Oregon physicians who provide care to children.
Results: Of 955 eligible physicians, 172 (18%) completed the survey. The majority of respondents were family physicians (84%), and most respondents (58%) were in private practice. The child health measures stratified into 3 priority tiers: high, medium, and low priority. The top-tier priority measures included childhood immunization status, well-child visits, adolescent immunization status, body mass index assessment, and developmental screening. Dental treatment services, adequate prenatal care, and lower-birth-weight infants were among the lower-tier measures.
Conclusions: The priority measures identified by rural family physicians reflect the relevance of the selected measures to their daily practice responsibilities, with missed opportunities to improve community health.
Together, Medicaid and the Children's Health Insurance Program (CHIP) care for more than 1 in 3 children in the United States.1 Across the United States, family physicians provide 16% to 21% of physician visits for children,2 and in rural America, family physicians are often the medical home for children. Medicaid and CHIP are state-administered programs that work with health care practices and community programs to ensure a high-quality system of care for these children. Quality metrics are often developed by expert consensus to emphasize high-impact preventive and evidence-based care, with the intent to be both useful and important to primary care providers. Such is the case with the 24 core recommended pediatric quality measures developed for voluntary use by states under the 2009 CHIP Reauthorization Act (CHIPRA).3 Together, the CHIPRA core set of 24 measures are intended to create a comprehensive picture of the quality of care provided to children, including primary and preventive health care.3 While great effort was made to have balanced stakeholder representation in measure development, the perspective of the rural family physician is missing.
These quality measures drive some changes to the primary care practice environment, requiring that the development of metrics be an iterative process. Improvement requires primary care physicians to accept responsibility for community health beyond the walls of their practices; a number of measures relate directly to how physicians get information about care provided outside of their clinic, such as asthma-related emergency department visits and preventive dental treatments. As practices change, often in response to state and national priorities, metrics that initially seemed unimportant may gain priority among health care providers.
Practically speaking, it is not realistic to suggest a provider pay attention to and routinely use 24 measures, especially within the current practice environment. Not counting private commercial insurers' measures and reports, there are several hundred quality measures that a rural family medicine practice could be asked to generate, review, and use.4 In addition, the workload of care for adult patients with complex conditions threatens to crowd out time for child and maternity care in rural practices.
Matching measures to the priorities of the rural family physician maximizes the likelihood they will be used. At the same time, providers may give low priority to some measures that are well-supported by current evidence and have potential to improve patient outcomes; identifying these areas may prove useful for outreach and quality improvement efforts.
With this in mind, we surveyed rural Oregon primary care clinicians to collect provider-level information about the priority and usefulness of the core child health measures to learn clinicians' views about the utility of quality measures at the practice level to improve quality of care. We also wanted to assess whether factors such as ownership, size, and rurality influence the perceived value of these quality measures.
Methods
Survey Development and Testing
The Oregon Rural Practice-based Research Network (ORPRN) and the Oregon Health Authority jointly developed a survey to gather clinician-level input on children's quality measures and quality improvement efforts. Given the rural setting of the study, the survey excluded the CHIPRA measure describing catheter-associated bloodstream infections per line day in the pediatric or neonatal intensive care unit. The survey included questions on ratings of individual proposed measures for overall usefulness, with a request to select the top 5 priorities for quality measurement in the physician's practice. The survey received input from Oregon Health & Science University Family Medicine faculty, who focused survey questions on the usefulness of the proposed quality measures to individual clinicians and removed questions specifically targeting publicly insured children (see the Appendix).
After approval of the questionnaire and study procedures by the institutional review board at Oregon Health & Science University, ORPRN built the survey using the web-based application SurveyMonkey. ORPRN conducted pilot tests to ensure proper E-mail delivery, question succession, survey completion, and reportability.
Sample and Survey Administration
The survey sample was drawn from the Oregon Medical Board (OMB) list of current active licensees. Subjects were eligible to participate if the OMB registry indicated (1) an active MD or DO license, (2) a practice address in Oregon, (3) practicing in a ZIP code designated as “rural” by the Oregon Office of Rural Health,5 and (4) a primary specialty that routinely includes care for pediatric patients: family medicine, family practice, general practice, or pediatrics. Of the subjects meeting these criteria, we excluded any duplicate E-mail addresses in the OMB registry and those who had previously opted out of receiving surveys from SurveyMonkey. From the OMB's list of 16,681 subjects, 973 were eligible to receive the survey.
One week before administering the survey, ORPRN mailed an introductory postcard to eligible subjects. From January 14 to February 18, 2013, ORPRN administered the web-based survey. Weekly reminder E-mails were sent to nonresponders to solicit participation.
Of the 973 surveyed physicians, 18 were ineligible because the E-mail address listed in the OMB registry was invalid. Of the remaining 955 eligible physicians, 172 (18%) completed the survey. For the results reported here, we excluded 33 physicians who indicated they did not treat children, did not have any children on their patient panel, or listed a specialty of obstetrics or internal medicine.
Data Analysis
We calculated descriptive statistics of respondent demographics and practice characteristics as the percentage of nonmissing responses. Rural-urban commuting area codes,6 which we used as a measure of the rurality of practice locations, were determined by matching to respondents' reported ZIP codes and were aggregated into established categories. To assess potential nonresponse bias, we compared the distribution of rurality among respondents—as defined in Table 1, which describes respondent characteristics—to the entire sampling frame. Using χ2 tests, we also compared the relative distributions of specializing in general pediatrics versus family medicine or general medicine, private practice versus other ownership, and solo/small/large size of practice with data from the Oregon's 2009 Physician Workforce Survey.7 Only practice size differed at a statistically significant level, with only 25% of survey respondents (but 38% of Oregon physicians) working in practices of ≥11 physicians. However, in more rural regions (southern, eastern, southwestern, and central Oregon), only 22% of physicians belong to these larger practices, and the overall distribution is similar to the survey respondents. Thus, we did not find any significant nonresponse bias with respect to rurality, size of practice, specialty, or practice ownership.
To analyze physician attitudes toward quality measures, we examined 2 types of questions. In the survey, physicians were asked to answer yes or no to the question of whether each measure was useful. The choices included 22 separate CHIPRA measures plus 9 separate measures from the US Agency for Health care Research and Quality's Consumer Assessment of Health care Providers and Systems (CAHPS)—a total of 31 items. In the next step, physicians were asked to choose from the same list of 22 CHIPRA measures the 5 measures they considered top priorities, plus a single item representing all the CAHPS measures as a group. Because the CAHPS measures were itemized in “usefulness” questions, but not in the “priority” question, when we compared these 2 concepts, we excluded CAHPS from further analysis.
We calculated the percentage of physicians who considered each measure useful or a priority, ranking measures from the highest percentage to lowest. For 95% confidence intervals, we used a normal approximation. Because each measure had a 50% chance of selection as “useful,” we considered a result statistically significant if the entire 95% confidence interval for the proportion of physicians was above this threshold. Similarly, we considered a measure to be a statistically significant “priority” if the 95% confidence interval was above 21.7% (or a 5 in 23 chance) of selection.
We were especially interested in potential differences between physicians' perspectives in more or less rural areas, with higher or lower proportions of patients covered by Medicaid, in private practice, or employed by a hospital or similar system, and in larger or smaller practice settings. For each of these subgroups, we repeated the calculations of percentages and rankings by usefulness and priority, then visually inspected the results for patterns. We also tested for differences in proportions between subgroups of physicians on individual quality measures using the Pearson χ2 test (or Fisher exact test for smaller numbers).
Results
As described in the Methods, only physicians caring for children were surveyed. The survey had a response rate of 18%. The majority of the respondents were family physicians, and 27% of the family physicians reported that they delivered babies.
The majority of respondents have specialties in family medicine (84%), and more than half (58%) were in private practice. The rural-urban commuting area–defined degrees of rurality6 and our sample demonstrated that 23% and 56% of family physicians practiced in metropolitan and large rural towns, respectively, whereas 12% and 10% of family physicians practiced in small rural locations and isolated rural locations, respectively. The majority of physicians (59%) have patient panels with more than half of the children insured through Medicaid. Across all respondents, the mean percentage of children (aged ≤18 years) they cared for was 29.9%, with a mean of 19.5% for family medicine physicians and 91.7% for general pediatricians. The median percentage of children cared for by family medicine and general pediatric physicians was 20% and 99%, respectively. This distribution is similar to that in the 2012 Oregon Workforce Survey,8 in which 457 family physicians and 139 general pediatricians reported on the percentage of children and adolescents given care in their practices.
Measures are reported by priority ranking and with usefulness scores depicted (Figure 1). Priority scores range from 2.9% to 69.8%; usefulness scores range from 20.9% to 86.3%.
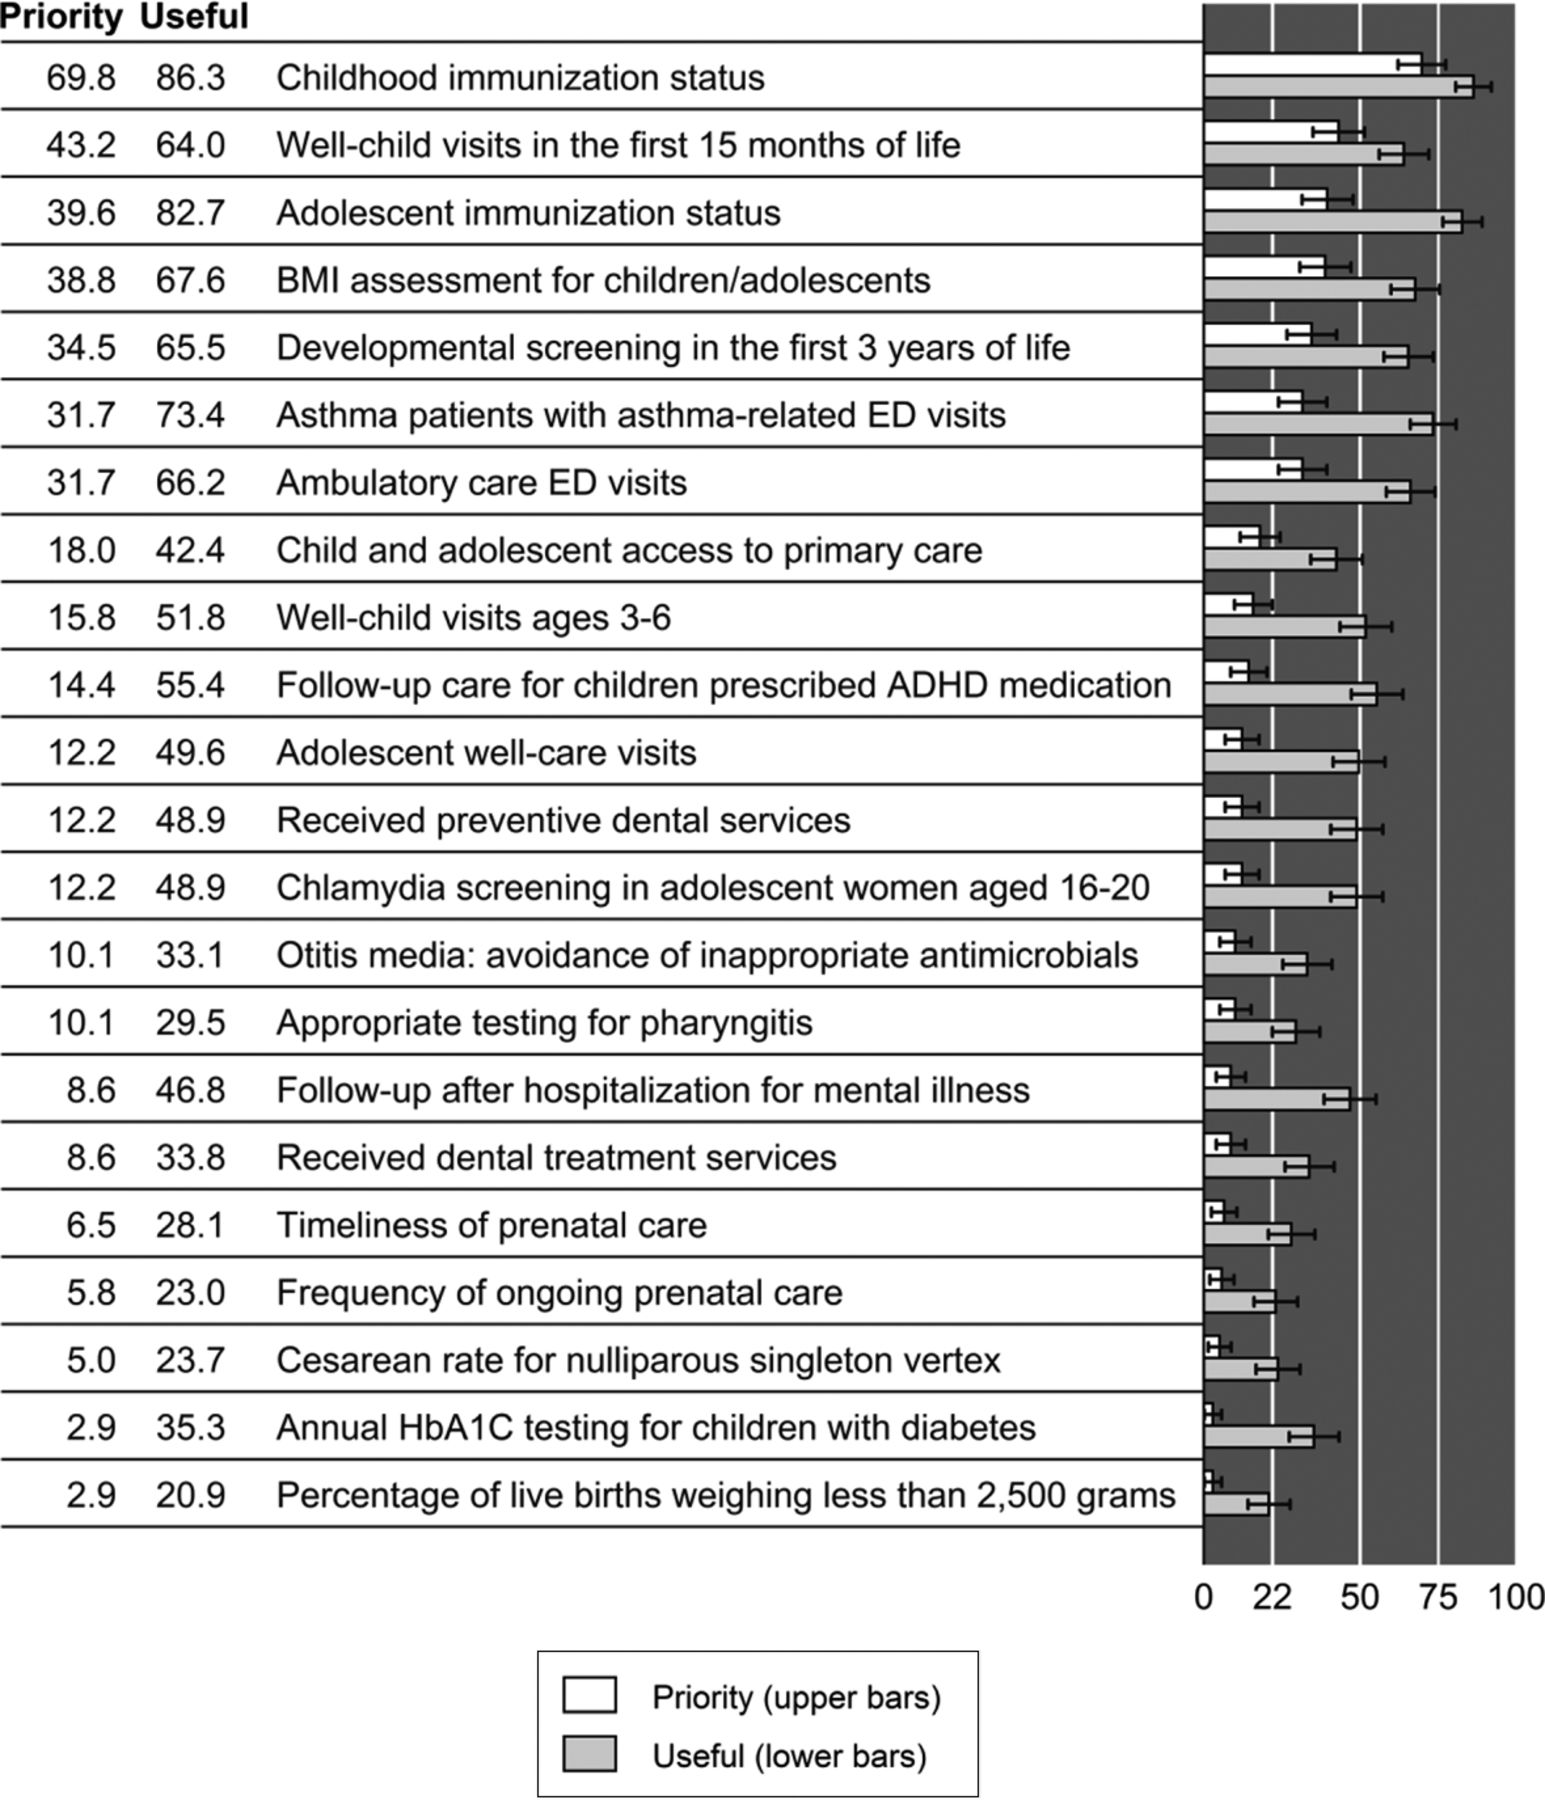
Measure usefulness and priority. For “priority” questions, the threshold of better or worse than chance is 5/23, or about 22%. For “useful” questions, the threshold is 50%.
Quality measures were ranked next by usefulness/priority across the cohort and then ranked according to clinician and practice characteristics. The top 5 priorities included childhood immunization status (69.8%), well-child visits in the first 15 months of life (43.2%), adolescent immunization status (39.6%), body mass index assessment for children/adolescents (38.8%), and developmental screening in the first 3 years of life (34.5%). No statistical variation was seen across a number of practice characteristics, including specialty, practice size, patient-centered primary care home attestation, and isolation/rurality.
The 22 child health measures stratified into 3 tiers: high priority, medium priority, and low priority (Figure 2). There was agreement across all characteristics on the importance of childhood immunization status and adolescent immunization status; however, nonstatistically significant variation was seen for other measures.
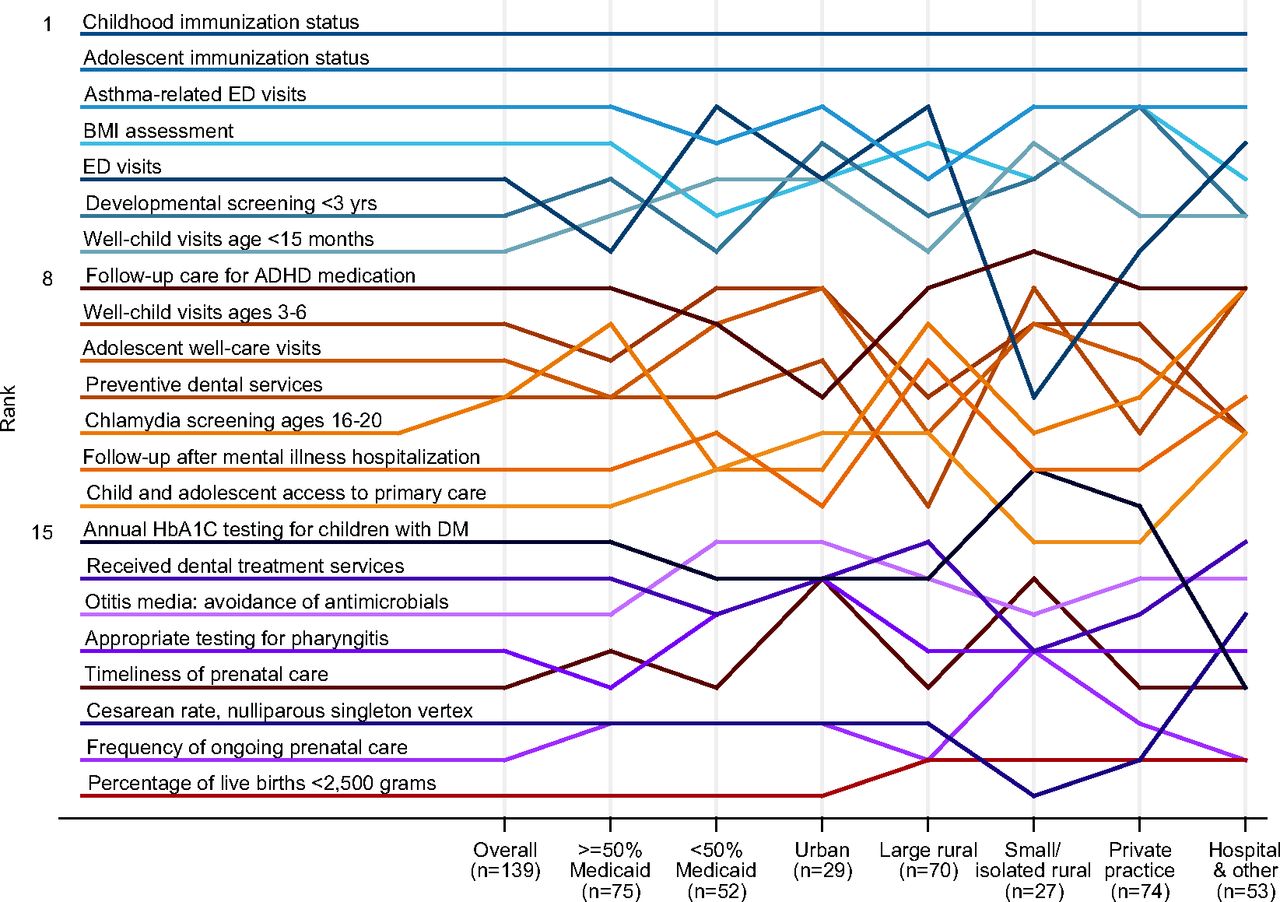
Rankings of the usefulness/priority of quality measures, overall and by practice characteristics.
Discussion
Family medicine doctors play an important role in pediatric care, and it is important to include those busy clinicians in the practice's quality improvement (QI) approach. Understanding the context in which QI interventions take place is essential to building the science of QI and making it useful to the front line of practice clinicians.9 The ORPRN Child Health Measures Survey describes the value of CHIPRA child health quality measures in terms of physician priorities.
Nationwide, family medicine physicians provide a medical home for one third of the current US child population and, in rural Oregon settings, family physicians are the main source of care for >80% of the regions' children.2,10 The decreasing scope of care provided by family physicians may affect the motivation of clinicians to make child health measures a priority. Fewer family physicians are performing deliveries, with a decline from 17.0% in 2003 to 10.1% in 2009.11 Our survey reports that only 27% of responding rural Oregon family physicians delivered babies in 2013, down from 48% in 2002.12 The number of family physicians caring for children is also on the decline: 68% of US family physicians cared for children in 2009, compared with 78% in 2000.13 Given the demands of primary care and the decreasing scope of care, especially in rural settings, what are the best approaches to align the child health quality metrics with the priorities of busy primary care practices and clinicians? Where externally dictated priorities align with physicians' own priorities, they are more likely to be acted on. Practice-based research networks, such as ORPRN, have shown that practices learn by doing—participating in action research that provides a self-discovery process, where practice-wide QI teams take ownership of the outcomes. An important first step is to engage primary care clinicians in addressing the child health measures, improving performance, and understanding their quality measure priorities. Priority measures bring a higher likelihood of clinical practice leadership developing an action plan to meet the measure's benchmark.14
There are many elements in quality measurement that potentially contribute to a metric's usefulness or lack thereof. Beyond clinical relevance, there is also the physician's (perceived) ability to influence that element of patient care, the time required for documenting care or identifying high-risk patients, and the accuracy of the data used to compile the measure, to name a few. Identifying specific components of the usefulness of quality metrics was outside the scope of this project but could be useful in future discussions. These components will likely shift with time as medical informatics provides better measurement tools and physicians reconsider the reach of their influence and responsibility. Regardless, the more useful a metric is to the clinicians who provide care, the more useful it is to the general community as well, because it will more accurately reflect the quality and safety of care and help to drive improvement.
Childhood immunization status ranked highest for both usefulness and priority among all subgroups. This measure applies universally to all children, yields effective prevention, costs relatively little money and time, and can be performed during regular clinic visits even when the child is being seen for another reason. In addition, in comparison with other measures, electronic health records and Oregon's ALERT Immunization Information System help make the data for this particular measure complete and reliable.
Not all quality measures under discussion were currently useful to even a majority of providers. Potentially, all the measures could have been called “useful” by all respondents, but only 7 of 22 were rated useful by significantly more than half of respondents. Eight measures were useful only for a minority. Included in this list of 8 measures are quality metrics for dental treatment, prenatal care, and mental illness care. Naturally, the usefulness rankings tracked closely with priorities. How do we engage busy family physicians to address these important community health measures?
We had anticipated that smaller and more rural practices would report different priorities than their larger, more urban counterparts. Previous study of quality improvement has shown that practice size makes a difference. Small practices report time constraints, cost of activities, limited health information technology and data management resources, lack of trained staff, and lack of financial incentives as common barriers to practice-wide QI implementation.15 However, we found no significant differences among either usefulness or priority ratings between larger and smaller practices or among those located in isolated areas.
When physicians identified their highest priorities, 3 consistent tiers emerged, regardless of rurality, practice size, private ownership or percentage of patient panel on Medicaid. The 7 measures consistently ranking in the top tier measures may be considered as within the clinician's sphere of influence, of high occurrence, and relevant to the day-to-day care of patients: childhood immunizations, well-child visits in the first 15 months of life, adolescent immunization status, body mass index assessment, developmental screening, ambulatory care emergency department visits, and patients with asthma who have asthma-related emergency department visits.
The bottom tier of priority measures include annual HbA1c testing, dental treatment services, percentage of low-birth-weight infants, otitis media treatment, pharyngitis testing, cesarean delivery rates, frequency of ongoing prenatal care, and timeliness of prenatal care. These measures are important in describing the health of the children in the practice but are of low frequency; they perhaps are viewed as outside the sphere of influence of the primary care physician, which greatly decreases each measure's actionability. The ability of the electronic medical record to capture these quality measures is also limited.16 Furthermore, claims-based quality metrics may be viewed by physicians as inaccurate.
Limitations
The response rate of 18% is low, limiting the generalizability of the results; however, physician survey response rates of <20% are not unusual.17⇓–19 Assessing for a nonresponse bias, as described in our data analysis, is at least as important as assessing the response rate.20 Since the survey provides a cross-sectional look at only the physician perspective, nonphysician clinician responses are unknown, which reflects an additional limitation of the study. Physicians were asked to identify the 5 measures representing their top 5 priorities. The criteria that were used to make this selection are not addressed.
This study conducted in rural Oregon may not reflect the perspectives of rural America beyond Oregon. It is likely, however, that the pressures of health reform and workforce limitations are similar in other parts of the country.
Implications
Many of the 23 selected CHIPRA core child health measures provide a snapshot of the quality of child health in the primary care physician's office, yet the role of the primary care physician in reporting on child health measures is unclear. For policymakers, our study indicates an opportunity to engage and develop partnerships with primary care physicians and their practices to discuss the role the entire set of child health metrics plays in providing a comprehensive picture of the quality of child health care in their practice. Given the implications for providing behavioral health, dental health, and maternal health in primary care settings, it is imperative that family physicians become involved in population health, extending the reach of primary care. Identifying the infrastructure support and reporting mechanisms to create actionable benchmarks is needed, especially as they fit within the scope of care provided by rural clinicians.
Acknowledgments
The authors are grateful for editing and publication assistance from LeNeva Spires, Publications Manager, Department of Family Medicine, Oregon Health & Science University, Portland, Oregon.
Appendix
Survey
Please complete this brief (less than 10 minutes) survey to provide your input on the Centers for Medicare and Medicaid Services (CMS) Quality Measures.
The survey includes the following sections:
Your feedback on the types of data that are most useful to you in your practice
Your input on the CMS Quality Measures for Children's Health Care
Some basic information about your practice
This survey is your opportunity to help inform the quality improvement efforts that are underway at the state and national levels. It will provide a starting place for future discussions intended to further inform the selection and development of measures to support quality health care for the children in our state.
The information that you provide will NOT be reported or identified by individual provider or practice.
Thank you for your time completing this survey.
Data That Are Useful to You in Your Practice
How useful do you find the following types of information for improving the quality of care you provide for children and their families? (Not at all useful, somewhat useful, useful, very useful)
Immunization rates for children in your practice
Well-child visit rates for children in your practice
Utilization rates for services provided to your patients outside of your practice (eg, ER utilization, WIC visits)
Parent survey data about the content of the well-child visit (eg, whether recommended aspects of well child care were addressed during the visit) for your practice
State-reported standardized measures that compare the quality of care for children served by your practice with the quality of care for children in other practices in the state
What is the number one topic related to your care of children on which you would like to have quality measurement data for your practice?
Usefulness of the CMS CHIPRA Quality Measure fulness of the CMS CHIPRA Quality Measure
3. For each measure, check the box if the measure is USEFUL for your practice.
1. Timeliness of prenatal care
2. Frequency of ongoing prenatal care
3. Percentage of live births weighing less than 2,500 grams
4. Cesarean rate for Nulliparous Singleton Vertex
5. Childhood immunization status
6. Adolescent immunization status
7. BMI assessment for children/adolescents
8. Developmental screening in the first three years of life
9. Chlamydia screening in adolescent women aged 1620
10. Well-child visits in the first 15 months of life
11. Well-child visits in the 3rd, 4th, 5th, and 6th years of life
12. Adolescent well-care visits
13. Received preventive dental services
14. Child and adolescent access to primary care practitioners
15. Appropriate testing for children with Pharyngitis
16. Otitis Media with effusion (OME)–avoidance of inappropriate use of systemic antimicrobials in children
17. Received dental treatment services
18. Ambulatory care emergency department (ED) visits
19. Asthma patients with one or more asthma-related ED visits
20. Follow-up care for children prescribed ADHD medication
21. Annual pediatric Hemoglobin A1C testing for children with DM
22. Follow-up after hospitalization for mental illness
23a. Family experience of getting needed care
23b. Family experience of getting care quickly
23c. Family experience of how well doctors communicate
23d. Family experience with specialized services for children with chronic conditions
23e. Family experience with prescription medicine for children with chronic conditions
23f. Family experience with shared decision-making for children with chronic conditions
23g. Family experience of getting needed information for children with chronic conditions
23h. Family experience of coordination of child's care
23i. Family experience with child's personal doctor or nurse Copy of page: Usefulness of the CMS CHIPRA Quality Measure
4. Select the 5 measures that represent YOUR TOP 5 PRIORITIES for measurement for your practice.
Timeliness of prenatal care
Frequency of ongoing prenatal care
Percentage of live births weighing less than 2,500 grams
Cesarean rate for Nulliparous Singleton Vertex
Childhood immunization status
Adolescent immunization status
BMI assessment for children/adolescents
Developmental screening in the first three years of life
Chlamydia screening in adolescent women aged 1620
Well-child visits in the first 15 months of life
Well-child visits in the 3rd, 4th, 5th, and 6th years of life
Adolescent well-care visits
Received preventive dental services
Child and adolescent access to primary care practitioners
Appropriate testing for children with Pharyngitis
Otitis Media with effusion (OME)–avoidance of inappropriate use of systemic antimicrobials in children
Received dental treatment services
Ambulatory care emergency department (ED) visits
Asthma patients with one or more asthma-related ED visits
Follow-up care for children prescribed ADHD medication
Annual pediatric Hemoglobin A1C testing for children with DM
Follow-up after hospitalization for mental illness
Family experience of care measured by the Assessment of Healthcare Providers and Systems (CAHPS) 4.0 (Child Version Including Medicaid and Children with Chronic Conditions Supplemental Items)
About You and Your Practice
This section seeks information about you as a provider and the organizational setting in which you currently practice. Your primary practice setting is the location at which you spend the greatest amount of time in direct patient care.
5. Which of the following best describes your primary practice setting?
Private clinic or office
Community clinic/public health clinic
University/college health service clinic
Hospital-based ambulatory care clinic
Emergency department
Urgent care clinic
Other (please specify)
6. What is the zip code at your primary practice location?
7. What is the size of your primary practice?
Solo practice
Group practice (3 to 10 physicians)
Group practice (11 to 50 physicians)
Group practice (more than 50 physicians)
8. What is the scope of your practice?
Family/General Medicine
Obstetrics and/or Gynecology
General Internal Medicine
General Pediatrics
Does not apply
Specialty/Subspecialty (please specify)
9. If your primary specialty is Family Medicine, General Medicine, or OB/GYN, do you deliver babies?
Yes
No
Does not apply (not a Family Medicine, General Medicine, or OB/GYN practitioner)
10. What percentage of your patient panel is comprised of children ages 0–18?
11. What percentage of children (0–18) on your patient panel are insured by Medicaid/OHP?
12. What is your degree?
MD
DO
NP
PNP
PA
Other (please specify)
13. What is your specialty?
Family Medicine
Pediatrics
Other (please specify)
14. Is your primary practice currently participating in a quality improvement initiative or patient-centered medical home initiative? (select all that apply)
A. Yes, quality improvement initiative (eg, Safety Net Medical Home Initiative, ECHO, TOPMED, other)
B. Yes, patient-centered medical home initiative (eg, CPC, PCPC Institute, other)
C. Yes, practice is recognized as an Oregon Patient-Centered Primary Care Home (PCPCH)
D. No
E. Don't know
15. Please describe the quality improvement initiative in your practice. If none, just say “none.”
16. Please describe the patient-centered medical home initiative in your practice. If none, just say “none.”
17. Please indicate which tier your practice is as a recognized Oregon patient-centered primary care home (PCPCH)
Tier 1
Tier 2
Tier 3
Not recognized
Don't know
Thank you for completing this survey. If you have any questions about this survey, please feel free to contact: Charles Gallia (Charles.A.Gallia{at}state.or.us) or LJ Fagnan (fagnanl{at}ohsu.edu).
To be entered in a drawing for a new iPad, please click on the link below. You will be prompted to enter your name and email. By doing so, your personal information will be collected separately from your survey responses to ensure your anonymity. Thank you for your time!
Notes
This article was externally peer reviewed.
Funding: This work was conducted under an agreement between the Oregon Health Authority and the Oregon Rural Practice-based Research Network at the Oregon Health & Science University, and is funded by a 5-year quality demonstration grant from the Centers for Medicare and Medicaid Services (CMS) through Section 401(d) of the Child Health Insurance Program Reauthorization Act (CHIPRA). This document was developed under grant CFDA 93.767 from the US Department of Health and Human Services, Centers for Medicare & Medicaid Services.
Conflict of interest: none declared.
Disclaimer: The contents of this article do not necessarily represent the policy of the US Department of Health and Human Services; endorsement by the federal government should not be assumed.
- Received for publication August 6, 2014.
- Revision received January 23, 2015.
- Accepted for publication January 27, 2015.
References
In this issue


Jump to section
Related Articles
Cited By...
- No citing articles found.