
Abstract
Introduction: We aimed to demonstrate the application of national pediatric quality measures, derived from claims-based data, for use with electronic medical record data, and determine the extent to which rates differ if specifications were modified to allow for flexibility in measuring receipt of care.
Methods: We reviewed electronic medical record data for all patients up to 15 years of age with ≥1 office visit to a safety net family medicine clinic in 2010 (n = 1544). We assessed rates of appropriate well-child visits, immunizations, and body mass index (BMI) documentation, defined strictly by national guidelines versus by guidelines with clinically relevant modifications.
Results: Among children aged <3 years, 52.4% attended ≥6 well-child visits by the age of 15 months; 60.8% had ≥6 visits by age 2 years. Less than 10% completed 10 vaccination series before their second birthday; with modifications, 36% were up to date. Among children aged 3 to 15 years, 63% had a BMI percentile recorded; 91% had BMI recorded within 36 months of the measurement year.
Conclusions: Applying relevant modifications to national quality measure definitions captured a substantial number of additional services. Strict adherence to measure definitions might miss the true quality of care provided, especially among populations that may have sporadic patterns of care utilization.
- Community Health Networks
- Electronic Health Records
- Low-Income Population
- Pediatrics
- Quality of Health Care
Practice-based research capabilities have been enhanced by the increasing availability of data from electronic medical records (EMRs).1,2 In many cases, it is necessary to adapt definitions from previous data sources, such as health insurance claims data, for use in EMR data. In this study, we aimed (1) to demonstrate the application of national pediatric quality measures (primarily designed for claims-based data analyses) for use with EMR data and (2) to determine the extent by which rates might differ if specifications were modified to allow for some flexibility in measuring receipt of care based on how care is often provided in the “real world.” We applied these measures at a specific Oregon safety net family medicine clinic. This clinic was preparing to begin quality improvement efforts around child health but had not yet started; our work was designed to inform their future efforts.
We identified pediatric quality measures from those developed to meet the Children's Health Insurance Program Reauthorization Act (CHIPRA) of 2009 mandate. The CHIPRA included provisions for developing a set of universal measures to facilitate standardized reporting and measurement of pediatric care quality.3⇓–5 This set of measures was developed by the Agency for Healthcare Research and Quality in collaboration with the Centers for Medicare and Medicaid Services using a transparent, evidence-based process with input from multiple stakeholders.2,5 Twenty-four measures were selected as benchmarks of the quality of disease prevention, surveillance, and treatment for conditions commonly seen in primary care; most are measured as annual rates.3,4,6 Measures were chosen based on their validity, feasibility, and significance to improving health outcomes.
Analyses of the CHIPRA quality measures will ideally identify gaps in the provision of pediatric health care within and across populations.5,7 Information and specifics about the CHIPRA measures are reported elsewhere.3,5,8 Most of the CHIPRA measures were designed for querying health insurance claims data. Claims data, however, do not include the uninsured9,10 and may miss care that is delivered but not submitted for billing to the insurance plan.11,12 In addition, although many of the CHIPRA measures specify strict timelines for receipt of preventive services, there is a general lack of evidence for much of this specificity.12,13 Our study makes a valuable contribution to the literature by demonstrating the use of these measures in EMR data and highlights adaptations to reflect how pediatric care often is delivered in clinical practice.
Methods
Study Population
We conducted a retrospective cohort study of all children aged 6 months to 15 years as of July 1, 2011, who had at least one primary care visit to the clinic in 2010 (n = 1544). All clinicians at this study clinic use the same Epic Systems EMR (Verona, WI) for all clinical encounters; their EMR has been in place for more than 5 years.
Measures
Our practice-based research team of clinicians and researchers selected CHIPRA measures that were relevant to the clinic's current quality improvement efforts. We assessed each measure for age-appropriate patients from our cohort.
During team discussions regarding the measure specifications, clinicians highlighted concerns about whether the measures were reflective of and relevant to how care actually is delivered. This led to an iterative process with researchers, clinicians, and policymakers to establish clinically relevant, modified versions of the original CHIPRA specifications, as noted later. The purpose of creating these modifications was to incorporate some of the valid considerations for not meeting a strict measure requirement while staying true to the overall intent of the measure (eg, a child received the service but slightly late because of a lapse in insurance coverage, or the service was offered but the patient/parent refused). This process augmented our evaluation by allowing us to analyze both the feasibility of using EMR data and the extent to which quality measure rates changed when accounting for “real world” considerations. Our measure specifications are outlined below.
Well-Child Visits for Children by 15 Months
We first assessed the percentage of patients with ≥6 well-child visits (WCVs) with a primary care provider by 15 months of age. WCVs were counted if the visit was labeled as such in the EMR; the content of the visit was not assessed. This is congruent with the CHIPRA measure that uses Current Procedural Terminology and International Classification of Diseases, 9th revision, codes to identify WCVs.4 The clinicians at the study clinic reported that visits are sometimes missed or delayed and that it would be useful to try to capture visits at or near 15 months, 18 months, or both. To capture these potential visits, we modified the specifications to calculate the percentage of participants with 6 WCVs by 24 months of age. Controversy over the actual number of WCVs needed and over what time period remains.15
Receipt of Early Childhood Immunizations
We assessed the percentage of patients with the 10 CHIPRA-identified vaccine series completed by 2 years of age. The 10-vaccine series includes the following (numbers in parenthesis indicate the number of shots required per vaccine): diphtheria, tetanus, acellular pertussis (Tdap; 4); polio (3); measles, mumps, rubella (1); Haemophilus influenza type b (3 or 4); hepatitis B (3); varicella (1); pneumococcal (4); hepatitis A (2); influenza (2); and rotavirus (3). All children for whom this 10-vaccine series was incomplete were screened for exclusion criteria specific to individual vaccines, as indicated by the CHIPRA core set of technical standards.4 In our modified assessment, we calculated the percent completing each of 10 vaccines independently, recorded documentation of a vaccine having been offered but refused, and included data on vaccinations received up to 1 year after the CHIPRA deadline. This additional year was thought relevant because of vaccine shortages (eg, H. influenza type b), manufacturer recalls (eg, rotavirus), and changes in age recommendations (eg, hepatitis A). Immunization schedules change often because of new information, and although it is known that early vaccinations administered at intervals that are too close together can lead to inadequate immune response, dosing after the recommended time frame will still lead to adequate antibodies.14
Receipt of Adolescent Immunizations
We assessed the percentage of patients with one Meningococcal vaccine received between ages 11 and 13 and one Tdap or tetanus/diphtheria (Td) booster vaccine between ages 10 and 13.4 In this assessment, we also accounted for CHIPRA-specified exclusion criteria. Our modifications included information about declined vaccines and vaccines received by 15 years of age. This additional time frame was thought relevant because of variation in the age at which children might have received initial childhood Tdap immunizations and the age at which they might be entering an environment with higher likelihood of exposure to Meningococcal infections.
Documentation of Body Mass Index Percentile
We assessed the percentage of patients between ages 3 and 15 years who had a body mass index (BMI) percentile recorded during the measurement year as indicated by CHIPRA measure specifications.4 A systematic review of the literature uncovered a lack of evidence that screening for BMI improves health outcomes over any time period.16 Thus, our modification relaxed the time frame for this measure: We assessed whether patients had documentation of a previous BMI percentile recorded in the EMR's growth chart data within 36 months of the measurement year. This additional time frame was thought relevant because patients/parents will sometimes decline having a height, weight, or both measured at every visit, and a 36-month time frame was considered reasonable by clinicians to assess for obesity or significant changes in weight.
Data Collection and Analyses
We conducted a manual review of the full EMR chart for each study subject (n = 1544) between July 1 and August 31, 2011. To achieve this, we created standardized data collection algorithms for each measure. We then abstracted clinical data from the EMR following these standardized data collection algorithms and organized the data into a secure, electronic data management system formatted for this study using Research Electronic Data Capture software (Vanderbilt University, Nashville, TN).17 The Epic Systems' summer 2009 IU1 EMR platform utilized by the safety net clinic contains discrete fields for medical history, surgical history, social history, problem list, current and past medications, immunizations (including those given elsewhere if recorded in the Oregon Immunization Registry and added to the EMR, which is a common documentation practice for this clinic), allergies, vital signs, and encounter diagnoses. Free text is included in progress notes that contain both history and physical examination data. Our data collection algorithm utilized both discrete and free text fields, allowing us to include data that are found solely in physician encounter notes and that typically would be inaccessible in electronically abstracted data. Each chart took between 15 and 30 minutes to review. All recorded data were transferred into SPSS software, version 18.0.0 (IBM/SPSS, Inc, Chicago, Illinois) for statistical analyses. This study was approved by the Oregon Health & Science University Institutional Review Board.
Results
Demographics
Thirty-two percent of the 1544 study subjects were aged 6 months to 3 years, 47% were aged 4 to 11 years, and 21% were aged 12 to 15 years. There were a similar number of boys and girls. On the date of chart review, 68% of the subjects had public insurance, 19% had private insurance, 12% were uninsured/self-pay, and 1% were covered by Medicaid plans managed by private insurers (see Table 1).
Well-Child Visits
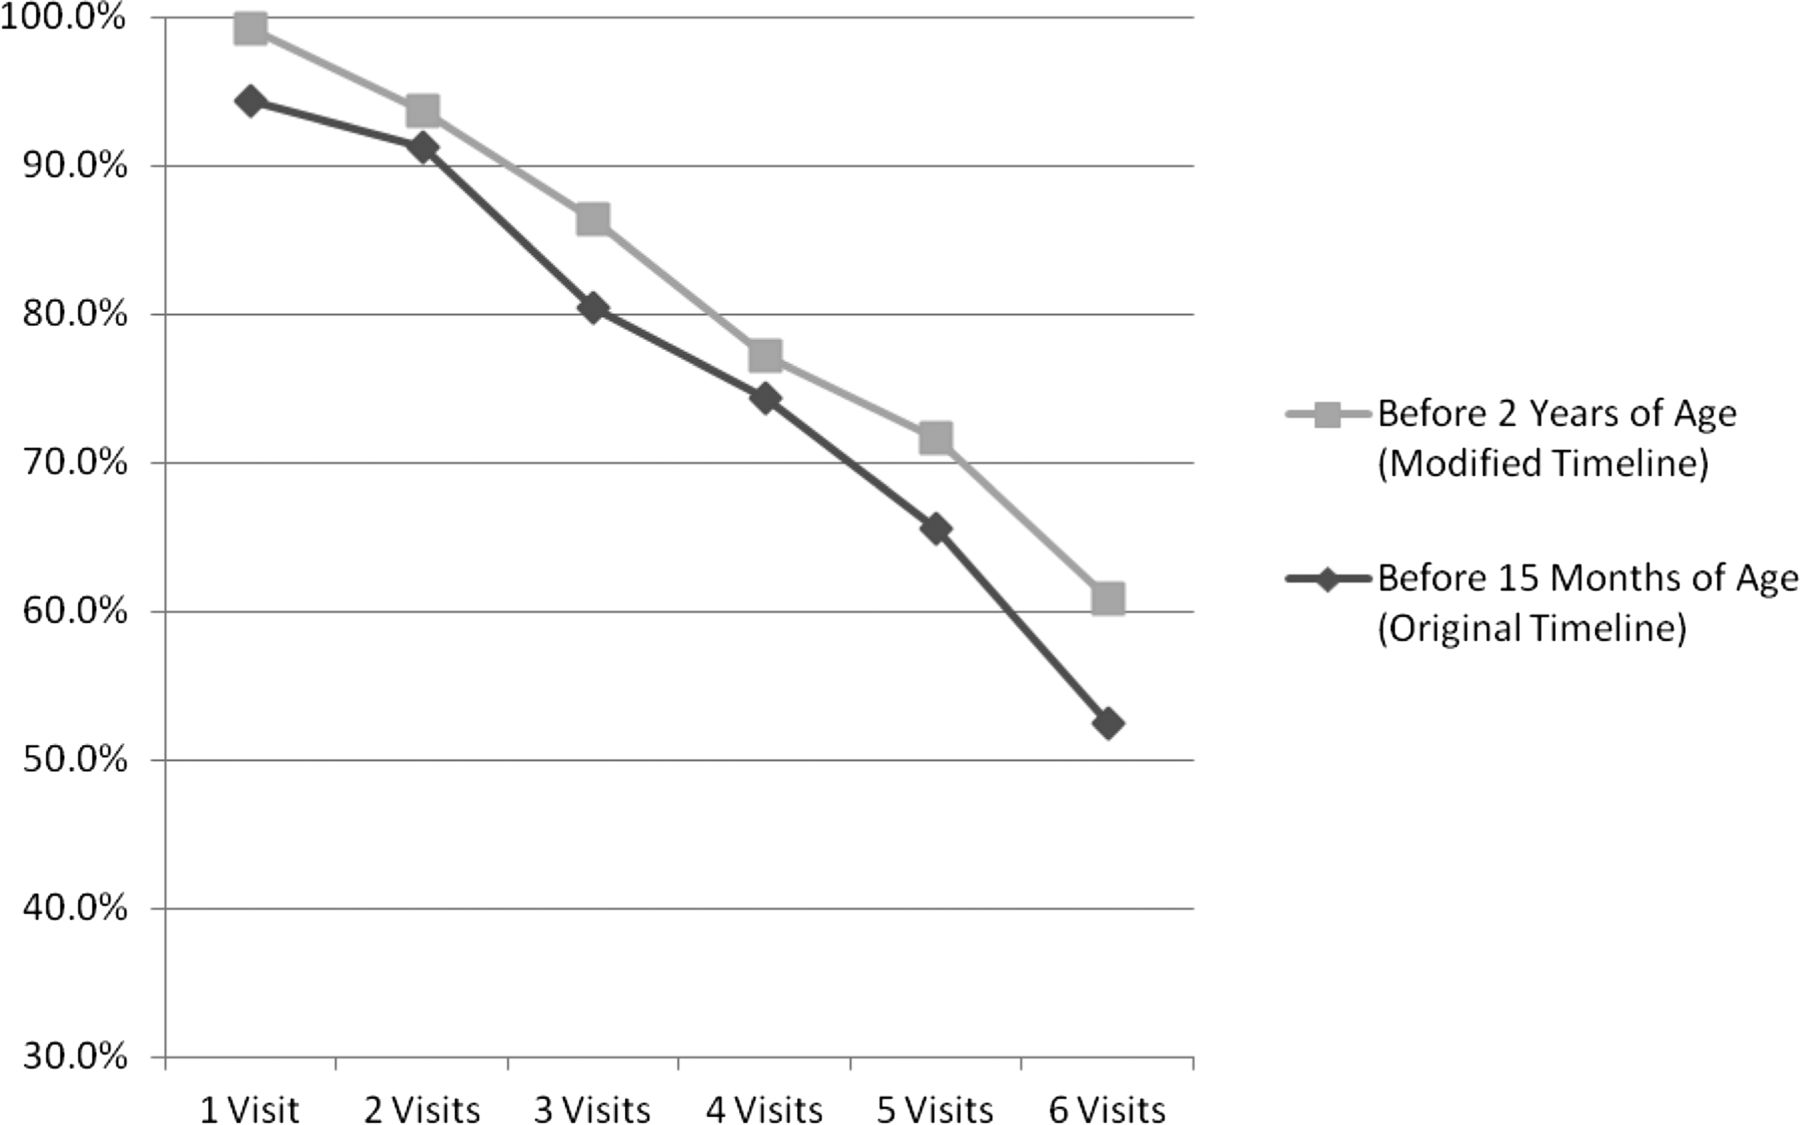
Among children <3 years of age, 52% attended ≥6 WCVs by the age of 15 months, and 61% had ≥6 visits by age 2 (see Figure 1).

Percentage of children who received the recommended number of well-child visits by 15 months of age versus by 2 years of age. The original timeline for having 6 well child visits is before 15 months of age; we modified this timeline to include children up to 2 years of age.
Immunizations
When considering each vaccine series independently, 8 of the 10 recommended vaccine series had been received by 65% of children by age 2 (rates were lower for rotavirus and hepatitis A). When including vaccination receipt by age 3 and excluding cases of parental refusal of vaccination from the denominator of the analysis, this number rose to more than 70%. When assessing the composite rate of immunization receipt, as suggested by the CHIPRA measure, only 10% of children (n = 14) completed 9 of the 10 vaccination series before their second birthday (we excluded rotavirus, which was not available at the clinic during the entire study time period because of a manufacturer's recall). The composite rate went up to 36% complete when counting all vaccines received by age 3 and excluding from the denominator patients with documented refusals of vaccine. Fifteen percent of children's parents had refused the child's receipt of ≥1 vaccine (n = 21); the distribution of refusals ranged from a single vaccine (n = 10) to documentation of all vaccines refused (n = 2).
Among adolescents, 43% met the CHIPRA measure of receiving both a Tdap (or Td) and meningococcal vaccination by 13 years of age. The Tdap or Td vaccination was received by 69% of adolescents by 13 years of age, and the meningococcal vaccination was received by 46%. When we included vaccinations through age 15, these values increased to 83% and 57%, respectively. The meningococcal vaccine was refused by 1% (n = 2), and there were no refusals for the Tdap vaccine recorded in patients' charts (see Figure 2).
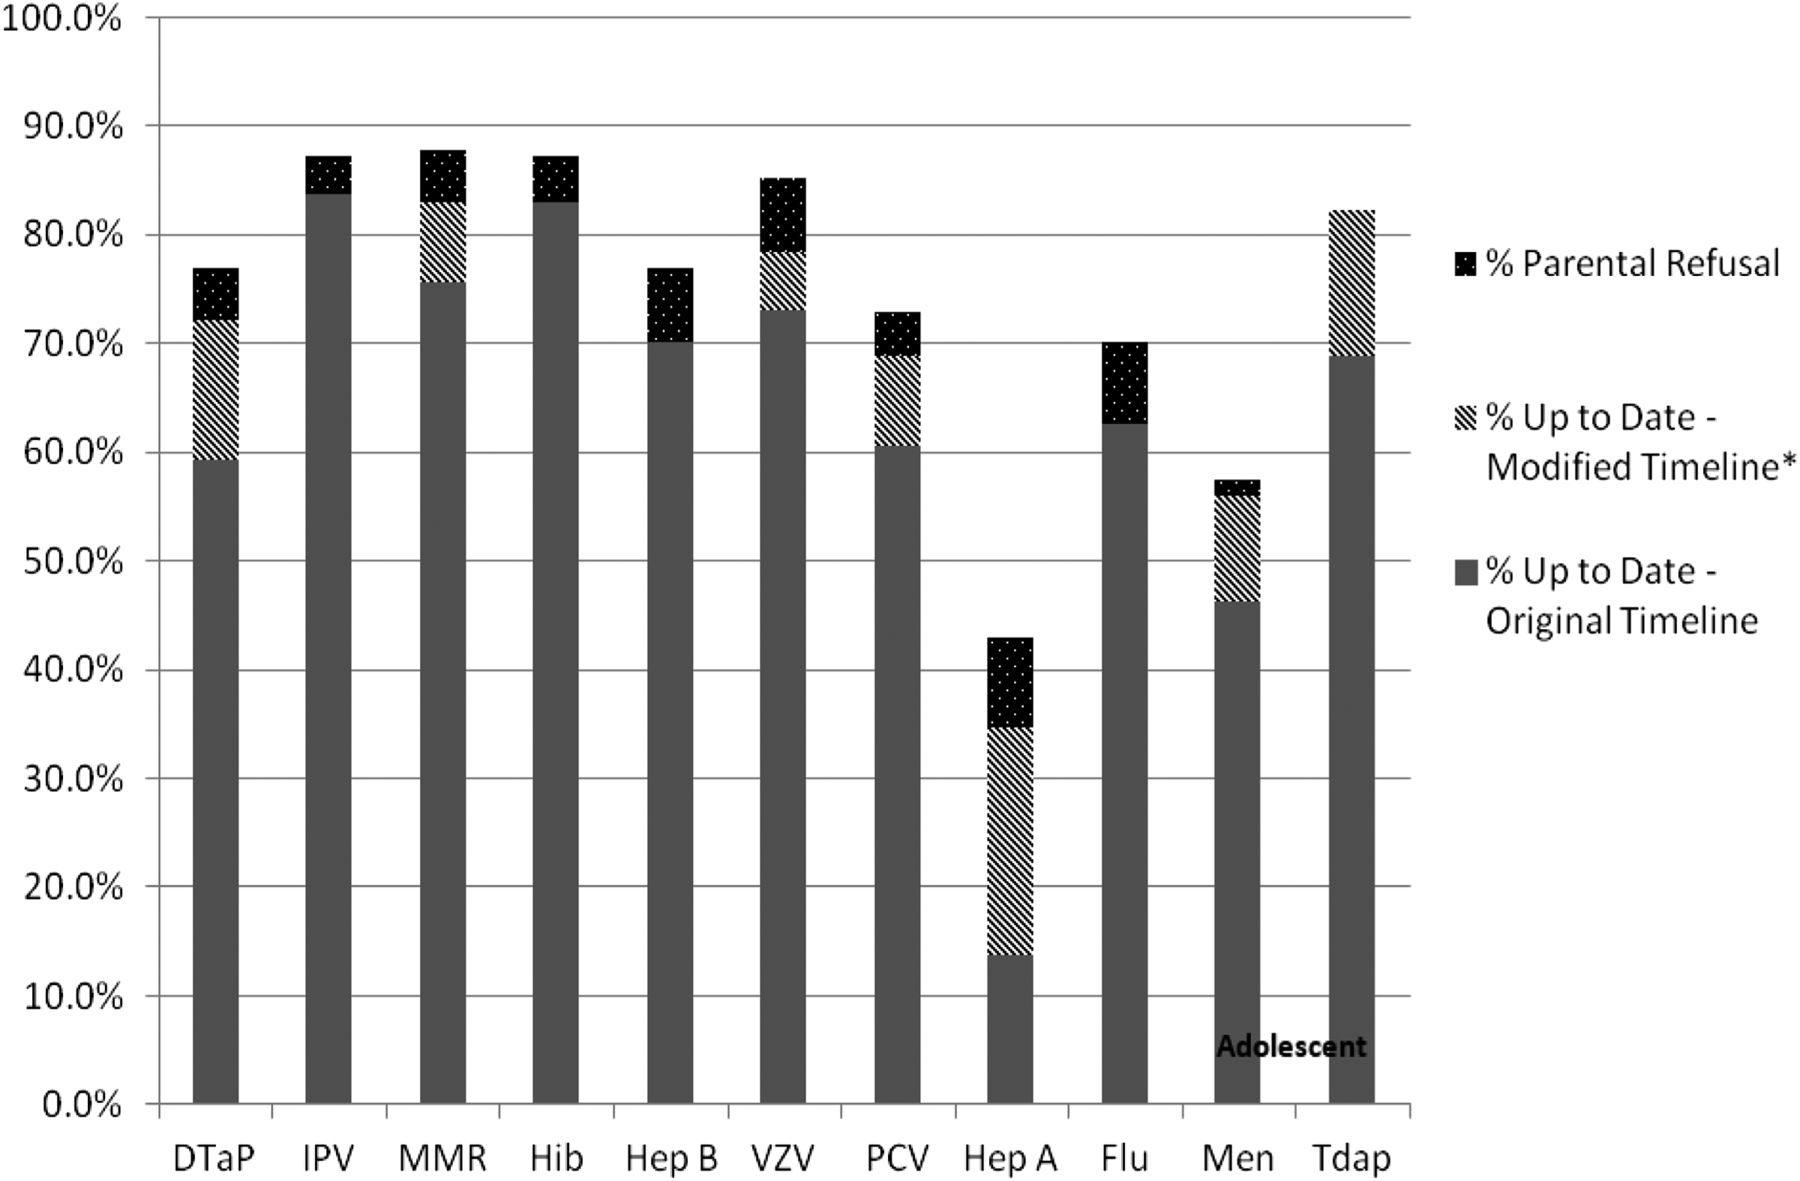
Percentage of children up to date on each vaccine series by age 2 versus those completed by age 3, percentage of adolescents up to date by age 13 versus those completed by age 15, and those with documentation of parent refusal. The original timeline means children are up to date with immunizations by age 2 and adolescents are up to date by age 13. The modified timeline includes children who completed childhood immunizations by age 3 and adolescent immunizations by age 15. Dtap, diphtheria, tetanus, acellular pertussis; IPV, polio; MMR, measles, mumps, rubella; Hib, Haemophilus influenza type b; Hep B, hepatitis B; VZV, varicella; PCV, pneumococcal; Hep A, hepatitis A; Flu, influenza; Men, meningococcal; Tdap/Td, tetanus, diphtheria acellular pertussis/tetanus, diphtheria booster vaccine.
BMI Documentation
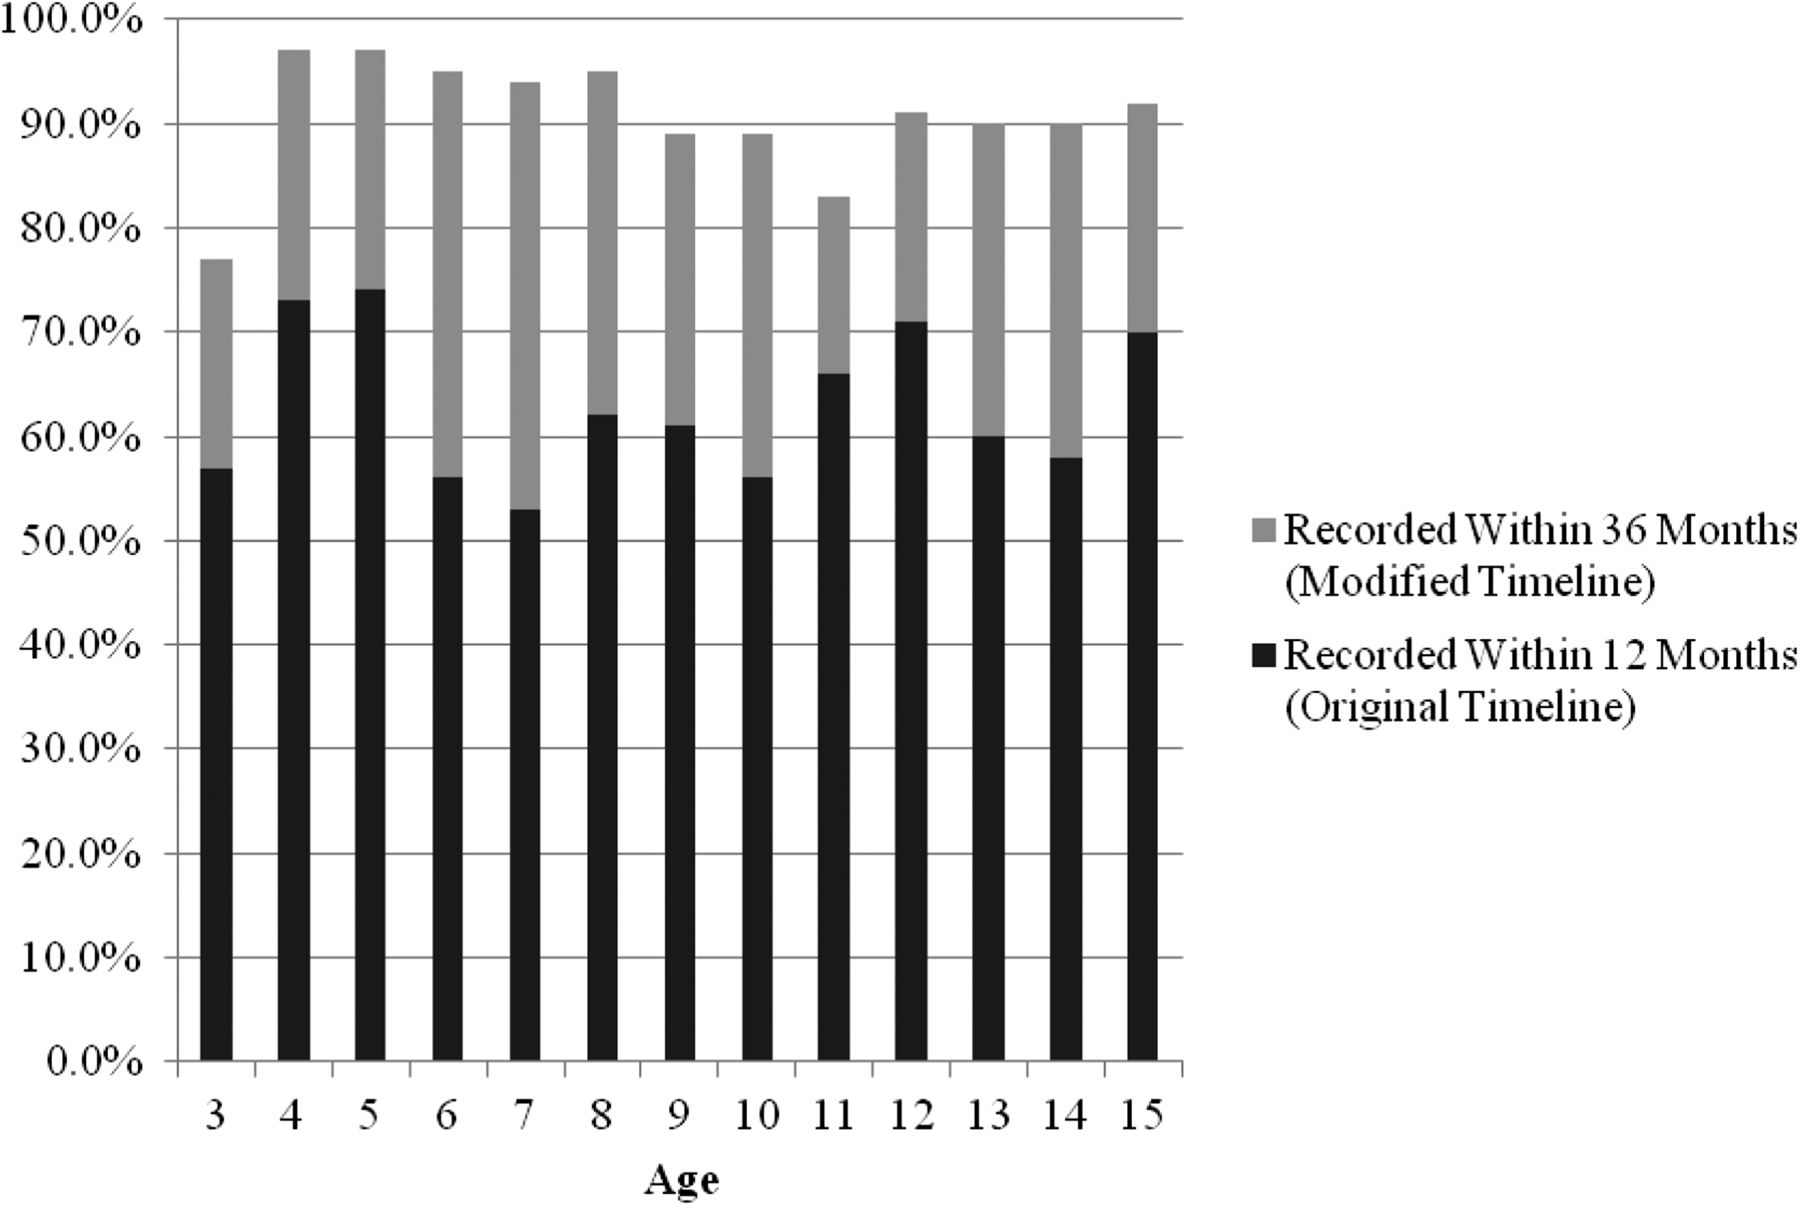
Among children 3 to 15 years of age (n = 1181), 63% had their BMI recorded during the measurement year. As for the measure modification, 91% had a BMI percentile recorded in their growth chart at any single time point within 36 months of the measurement year. When assessed by age, BMI percentile was recorded consistently for more than 50% of children within the measurement year with some variation but no consistent pattern. The lowest overall percentage recorded was for children 7 years of age (see Figure 3).

Percentage of body mass index (BMI) percentile recorded within 12 months and within 36 months of the measurement year, by age.
Discussion
We successfully calculated several pediatric care quality measures using outpatient EMR data from a safety net clinic, and we confirmed the feasibility of using EMR data to conduct such evaluations. Using EMR data likely allowed us to capture care delivered during periods when patients were not insured, which would not have been possible with insurance claims data.11 We also discovered that modest adjustments to measurement parameters enabled a real-world view of the care delivered. To the best of our knowledge, this is one of the first studies to utilize CHIPRA measures for practice-based research.
Practice Implications
As in previously reported analyses, the most significant adaptation required to assess performance of the CHIPRA measures using EMR data was the method used to determine a population denominator.18 Many of the CHIPRA measures were designed for assessing quality of care provided to patients enrolled in an insurance plan. Instead of the CHIPRA measures' enrollment-based approach, we used a visit-based approach (ie, ≥1 visit during the measurement year) to identify an “established” patient population.
Although most of the child health care services that we identified were delivered on time and at the recommended frequency in our study population, our modified assessments captured a substantial number of additional services. For example, 61% of children had 6 WCVs by age 2 compared with 52% by age 15 months. Immunization rates were higher when assessing rates by age 3 compared with age 2. Similarly, 91% of children had BMI percentile documented within 36 months of the measurement year, but only 63% did when only examining the study year. Of note, the percentage of BMI recorded in the chart was even higher if absolute BMI value was included in the measurement.
Another notable finding was the observed rate of immunization refusals. Our manual chart reviews allowed us to capture information about immunizations that had been offered but refused, which would have been invisible either in billing data or in automated chart abstraction. There are differing opinions about whether refusals should be counted in the denominator. On one hand, addressing parental refusal is part of ensuring high-quality care; on the other hand, it could be argued that the practice is responsible for offering recommended care but should not be penalized for low rates resulting from parental refusal. Standardized EMR documentation would help to improve quality assessments by capturing important explanations for not immunizing or for not delivering other evidence-based services (eg, the service was offered but refused). Furthermore, there is a need for more uniformity in documentation of services usually provided during a WCV (eg, developmental screening, preventive counseling) that also are being delivered during acute care visits. Currently, this care is not recorded in a standardized way outside of the WCV, and it is inadequately captured in other types of visit notes.
Policy Implications
This article suggests that expanding requirements beyond strict timeframes may yield a real-world view of care received compared with the results obtained when following the CHIPRA specifications. Allowing such “wiggle room” is especially important when measuring care provided to publicly insured populations because they sometimes have sporadic patterns of care utilization and often experience gaps in insurance coverage.9,19⇓⇓⇓⇓–24 These publicly insured families seek care more often when they can afford it or when they are insured.25⇓–27 Furthermore, without strong evidence to support strict timeframes, it is better to allow for some flexibility in measure specifications to reflect clinical practice.
This study also demonstrates the use of a visit-based approach to identify clinic populations when using EMR data. The visit-based model contrasts the traditional use of enrollment-based denominators derived from claims data as described by the CHIPRA definitions. Creating visit-based definitions is not well standardized (eg, Should a minimum number of visits be required to ensure continuity of care? Should at least one designated preventive care visit be required versus any type of visit?). Nevertheless, overall, this adapted approach is relevant to current policies, such as the establishment of patient-centered medical homes and accountable care organizations, in which providers will be responsible for measuring the quality of care being delivered to their population of patients by using EMR data.28,29 In practice models using a pay-for-performance financial scheme, seemingly small alterations to the requirements of these quality measures could result in very different completion rates and, consequently, have a profound impact on provider payment.10,30⇓–32
Next Steps
This pilot study fits within a larger body of research related to the use of EMR data for conducting quality assessments.18 To better quantify the extent to which the CHIPRA measures' capture rates differ when applied in EMR versus claims data, we suggest possible next steps for consideration. Estimates obtained using the “gold standard” of manual chart review should be compared with rates obtained when abstracting EMR data from the same population using electronic methods. This information should be further compared with rates obtained from administrative claims data only, as specified for the original CHIPRA measures, to allow for triangulation. We are actively working with our state policymakers to conduct these comparisons.
Limitations
This study has some important limitations. First, it was conducted in one practice; thus, our findings may not be generalizable to other sites. The methods used, however, could be replicated in other settings, although we acknowledge that our chart review methods were labor intensive. Second, besides information in the clinic EMR obtained from our state immunization registry, we did not have access to information about health care services utilized by our study population at other clinic sites (unless these were clearly documented in provider notes or elsewhere in the study clinic's EMR). Third, we identified a cohort of children who visited the study clinic during one calendar year only (2010), which may have over- or underestimated the clinics' true panel of “active” pediatric patients. Finally, although our modified measure specifications may provide a more complete picture of care receipt, we acknowledge that this approach would make rates from one site less comparable with another site unless both used the same time frame and other specifications.
Conclusions
It is possible to measure quality through a manual chart audit of an EMR, but without more generous timeframes and standardization practices for documentation, quality of care assessments may present an inaccurate picture of the quality of children's health care being delivered in primary care settings.
Acknowledgments
We acknowledge the clinic for helping us with this study, the patients whose medical records we used to conduct this analysis, and LeNeva Spires.
Notes
This article was externally peer reviewed.
Funding: This project was supported by grant 1 R01 HS018569 from the Agency for Healthcare Research and Quality (AHRQ), the Department of Family Medicine, and the Oregon Clinical and Translational Research Institute (OCTRI); grant no. UL1 RR024140 from the National Center for Research Resources (NCRR), a component of the National Institutes of Health (NIH), and NIH Roadmap for Medical Research. The funding agencies had no involvement in the design and conduct of the study; analysis and interpretation of the data; nor preparation, review, or approval of the manuscript.
Conflict of interest: none declared.
- Received for publication February 27, 2012.
- Revision received June 6, 2012.
- Accepted for publication June 19, 2012.


