
Article Figures & Data
Figures
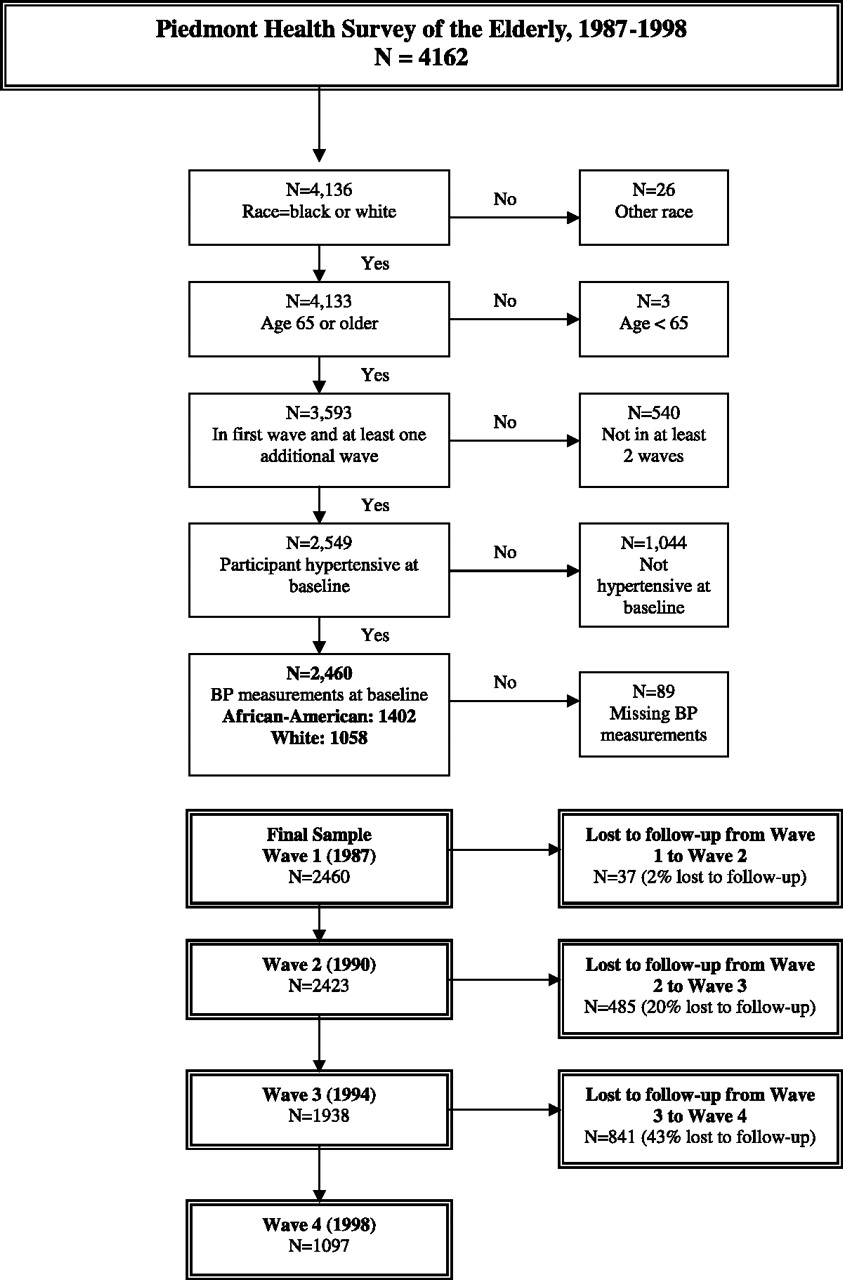
- Figure 1.
BP, blood pressure.

Tables
Wave 1 (1987) (n = 2460) Wave 2 (1990) (n = 2423) Wave 3 (1994) (n = 1938) Wave 4 (1998) (n = 1097) P* African American (n = 1402) White (n = 1058) African American (n = 1385) White (n = 1038) African American (n = 1123) White (n = 815) African American (n = 624) White (n = 473) Demographics Male (n [%]) 427 (30.5) 345 (32.6) 421 (30.4) 338 (32.6) 317 (28.2) 267 (32.8) 168 (26.9) 150 (31.7) NA† Age, yrs (mean [SD]) 73.3 (6.5) 73.4 (6.4) 76.3 (6.5) 76.4 (6.5) 79.2 (6.2) 79.1 (6.0) 82.2 (5.3) 81.9 (5.0) .5784 Years of education (mean [SD]) 7.4 (4.0) 9.9 (3.6) 7.4 (4.0) 9.9 (3.6) 7.5 (3.9) 10.0 (3.6) 7.8 (3.8) 10.2 (3.7) <.0001 Married (n [%]) 454 (32.4) 431 (40.7) 386 (27.9) 368 (35.5) 279 (24.8) 261 (32.0) 158 (25.3) 143 (30.2) <.0001 Currently working (n [%]) 171 (12.2) 119 (11.2) 113 (8.2) 76 (7.3) 76 (6.8) 47 (5.8) 34 (5.4) 25 (5.3) .3258 Annual household income (n [%]) $0-$3999 347 (24.8) 92 (8.7) 227 (16.4) 62 (6.0) 80 (7.1) 27 (3.3) 23 (3.7) 5 (1.1) NA† $4000-$6999 554 (39.5) 264 (25.0) 548 (39.6) 226 (21.8) 407 (36.2) 140 (17.2) 234 (37.5) 66 (14.0) $7000-$14,999 201 (14.3) 243 (23.0) 245 (17.7) 244 (23.5) 252 (22.4) 205 (25.2) 184 (29.5) 143 (30.2) ≥$15,000 80 (5.7) 265 (25.0) 91 (6.6) 276 (26.6) 88 (7.8) 215 (26.4) 65 (10.4) 153 (32.3) Lives in a rural area (n [%]) 851 (60.7) 512 (48.4) 845 (61.0) 503 (48.5) 689 (61.4) 399 (49.0) 392 (62.8) 241 (51.0) <.0001 General perception of health (n [%]) Excellent or good 623 (44.4) 598 (56.5) 588 (42.5) 519 (50.0) 431 (38.4) 401 (49.2) 269 (43.1) 238 (50.3) <.0001 Fair 528 (37.7) 303 (28.6) 434 (31.3) 255 (24.6) 322 (28.7) 168 (20.6) 187 (30.0) 134 (28.3) Poor 195 (13.9) 139 (13.1) 144 (10.4) 100 (9.6) 100 (8.9) 60 (7.4) 63 (10.1) 46 (9.7) Diagnosed Health Conditions (n [%]) Heart condition 177 (12.6) 171 (16.2) 223 (16.1) 194 (18.7) 188 (16.7) 161 (19.8) 127 (20.4) 93 (19.7) .0493 Cancer 96 (6.8) 172 (16.3) 110 (7.9) 198 (19.1) 102 (9.1) 179 (22.0) 96 (15.4) 130 (27.5) <.0001 Stroke 123 (8.8) 88 (8.3) 153 (11.0) 120 (11.6) 144 (12.8) 101 (12.4) 102 (16.3) 75 (15.9) .7824 Diabetes 349 (24.9) 182 (17.2) 383 (27.7) 199 (19.2) 313 (27.9) 174 (21.3) 201 (32.2) 105 (22.2) <.0001 One or more ADL limitation (n [%]) 158 (11.3) 94 (8.9) 287 (20.7) 191 (18.4) 254 (22.6) 149 (18.3) 246 (39.4) 159 (33.6) .0139 Healthcare characteristics (n [%]) Medicaid insurance 157 (11.2) 36 (3.4) 248 (17.9) 60 (5.8) 285 (25.4) 73 (9.0) 230 (36.9) 66 (14.0) <.0001 Medigap supplemental insurance 453 (32.3) 790 (74.7) 423 (30.5) 692 (66.7) 294 (26.2) 480 (58.9) 172 (27.6) 323 (68.3) <.0001 Ever resided in a nursing home 11 (0.8) 24 (2.3) 78 (5.6) 87 (8.4) 114 (10.2) 127 (15.6) 86 (13.8) 82 (17.3) <.0001 Resided in county where care was provided 834 (59.5) 819 (77.4) 700 (50.5) 665 (64.1) 637 (56.7) 508 (62.3) 359 (57.5) 302 (63.8) NA† Location of care No usual place 56 (4.0) 34 (3.2) 32 (2.3) 27 (2.6) 34 (3.0) 14 (1.7) 14 (2.2) 7 (1.5) <.0001 Private practice 870 (62.1) 915 (86.5) 774 (55.9) 802 (77.3) 610 (54.3) 620 (76.1) 463 (74.2) 435 (92.0) Public clinic 472 (33.7) 101 (9.5) 454 (32.8) 92 (8.9) 324 (28.9) 56 (6.9) 145 (23.2) 24 (5.1) Other‡ 0 (0.0) 4 (0.4) 8 (0.6) 21 (2.0) 3 (0.3) 2 (0.2) 0 (0.0) 7 (1.5) Satisfaction with care Satisfied 1,231 (87.8) 931 (88.0) 1079 (77.9) 807 (77.7) 799 (71.1) 591 (72.5) 491 (78.7) 382 (80.8) .0378 Dissatisfied 95 (6.8) 94 (8.9) 63 (4.5) 50 (4.8) 46 (4.1) 38 (4.7) 24 (3.8) 30 (6.3) * P indicates differences among respondent characteristics between African Americans and whites and is obtained from generalized estimating equations.
† P indicates there is a differential effect over time (significant interaction of race by time) in which differences in characteristics vary across time. Therefore, no main effects model can be presented (men, P = .0204; income, P < .0001; and lives in same county where care was provided, P = .0016).
‡ Other location: employee health facility and other.
ADL, activity of daily living.
Consistency of Care (n [%]) Wave 1 (1987) (n = 2460) Wave 2 (1990) (n = 2423) Wave 3 (1994) (n = 1938) Wave 4 (1998) (n = 1097) P* African American (n = 1402) White (n = 1058) African American (n = 1385) White (n = 1038) African American (n = 1123) White (n = 815) African American (n = 624) White (n = 473) Consistent care 1120 (79.9) 956 (90.4) 838 (60.5) 773 (74.5) 603 (53.7) 551 (67.6) 381 (61.1) 362 (76.5) <.0001 Inconsistent care† — — 381 (27.5) 214 (20.6) 454 (40.4) 250 (30.7) 224 (35.9) 106 (22.4) <.0001 No standard care 282 (20.1) 102 (9.6) 166 (12.0) 51 (4.9) 66 (5.9) 14 (1.7) 19 (3.0) 5 (1.1) <.0001 * Two-sided test of racial difference in consistency of care characteristics over time using generalized estimating equations.
† Inconsistent care was not assessed at wave 1 because the definition requires data from 2 or more time periods.
Wave 1 (1987) (n = 2460) Wave 2 (1990) (n = 2423) Wave 3 (1994) (n = 1938) Wave 4 (1998) (n = 1097) P* African American (n = 1402) White (n = 1058) African American (n = 1385) White (n = 1038) African American (n = 1123) White (n = 815) African American (n = 624) White (n = 473) Systolic BP (mean [SD]) 149.2 (19.6) 150.3 (19.2) 145.4 (22.0) 145.1 (20.2) 146.9 (23.3) 147.1 (22.2) 144.7 (22.5) 145.2 (21.3) .3792 Diastolic BP (mean [SD]) 82.9 (12.1) 80.1 (12.0) 79.3 (12.7) 77.1 (11.4) 76.4 (13.9) 73.7 (12.6) 74.2 (12.4) 71.1 (13.7) <.0001 BP control status (n [%]) Controlled 359 (25.6) 238 (22.5) 517 (37.3) 391 (37.7) 388 (34.6) 259 (31.8) 271 (43.4) 177 (37.4) .1478 Stage 1 HTN 635 (45.3) 515 (48.7) 399 (28.8) 314 (30.3) 283 (25.2) 235 (28.8) 184 (29.5) 163 (34.5) .0018 Stage 2 HTN 408 (29.1) 305 (28.8) 309 (22.3) 196 (18.9) 275 (24.5) 180 (22.1) 144 (23.1) 102 (21.6) .2408 Missing 0 (0.0) 0 (0.0) 160 (11.6) 137 (13.2) 177 (15.8) 141 (17.3) 25 (4.0) 31 (6.6) .0997 Antihypertensive single medication therapy (n [%]) ACE inhibitors 3 (0.2) 7 (0.7) 27 (1.9) 15 (1.4) 23 (2.0) 30 (3.7) 23 (3.7) 20 (4.2) .2247 Diuretics 459 (32.7) 280 (26.5) 324 (23.4) 194 (18.7) 227 (20.2) 117 (14.4) 125 (20.0) 63 (13.3) <.0001 Beta-blockers 47 (3.4) 79 (7.5) 32 (2.3) 68 (6.6) 16 (1.4) 39 (4.8) 21 (3.4) 23 (4.9) <.0001 Calcium channel blockers 10 (0.7) 31 (2.9) 37 (2.7) 45 (4.3) 69 (6.1) 65 (8.0) 71 (11.4) 41 (8.7) NA† Other antihypertensive medications (n [%]) 220 (15.7) 101 (9.5) 155 (11.2) 76 (7.3) 89 (7.9) 38 (4.7) 48 (7.7) 20 (4.2) <.0001 Diuretics + other antihypertensive agents (n [%]) 145 (10.3) 68 (6.4) 121 (8.7) 61 (5.9) 70 (6.2) 25 (3.1) 30 (4.8) 21 (4.4) NA† * P indicates differences in respondent characteristics between African Americans and whites and is obtained from gneralized estimating equations.
† P indicates there is a differential effect over time (significant interaction of race by time) in which differences in characteristics vary across time. Therefore, no main effects model can be presented (calcium channel blocker, P < .0001; diuretic combination therapy, P = .0059).
BP, blood pressure; HTN, hypertension; ACE, angiotensin-coverting enzyme.
BP Status (n [%]) Wave 1 (1987) Wave 2 (1990) Wave 3 (1994) Wave 4 (1998) Consistent Care (n = 2076 Inconsistent Care* (n = 0)) No Care (n = 384) Consistent Care (n = 1611) Inconsistent Care (n = 595) No Care (n = 217) Consistent Care (n = 1154) Inconsistent Care (n = 704) No Care (n = 80) Consistent Care (n = 743) Inconsistent Care (n = 330) No Care (n = 24) Controlled 526 (25.3) — 71 (18.5) 671 (41.7) 167 (28.1) 70 (32.3) 441 (38.2) 184 (26.1) 22 (27.5) 307 (41.3) 131 (39.7) 10 (41.7) Stage 1 HTN 974 (46.9) — 176 (45.8) 520 (32.3) 147 (24.7) 46 (21.2) 367 (31.8) 133 (18.9) 18 (22.5) 232 (31.2) 106 (32.1) 9 (37.5) Stage 2 HTN 576 (27.7) — 137 (35.7) 361 (22.4) 92 (15.5) 52 (24.0) 317 (27.5) 120 (17.0) 18 (22.5) 171 (23.0) 70 (21.2) 5 (20.8) Missing 0 (0.0) — 0 (0.0) 59 (3.7) 189 (31.8) 49 (22.6) 29 (2.5) 267 (37.9) 22 (27.5) 33 (4.4) 23 (7.0) 0 (0.0) * Inconsistent Care was not assessed at wave 1 because the definition requires data from 2 or more time periods.
HTN, hypertension.
- Table 5.
Odds Ratios and 95% CI for the Association Between Medical Care Receipt and Blood Pressure Control among the Elderly
Model* Variable Odds Ratio (95% CI) 1 No standard care 1.00 Inconsistent care 2.08 (1.67, 2.59)† Consistent care 1.51 (1.24, 1.84)† 2 No standard care 1.00 Inconsistent care 2.09 (1.68, 2.60)† Consistent care 1.54 (1.26, 1.88)† African American race 1.10 (0.98, 1.23) 3 No standard care 1.00 Inconsistent care 1.41 (1.12, 1.78)‡ Consistent care 1.34 (1.09, 1.64)‡ African American race 1.10 (0.98, 1.24)§ 4 No standard care 1.00 Inconsistent care 1.35 (1.03, 1.77)‖ Consistent care 1.26 (0.99, 1.59)§ African American race 1.04 (0.90, 1.19) 5 No standard care 1.00 Inconsistent care 1.14 (0.85, 1.52) Consistent care 1.00 (0.78, 1.28) African American race 1.06 (0.90, 1.24) * Model 1, unadjusted; model 2, adjusted for race; model 3, adjusted for race, age at baseline, gender, and study year; model 4, adjusted for race, age at baseline, gender, and study year, marital status, work status, education, and income; model 5, adjusted for race, age at baseline, gender, and study year, marital status, work status, education, income, residence in a rural area, nursing home residence, Medicaid insurance, Medigap supplemental insurance, satisfaction with medical care, physical limitation, use of antihypertensive medication, and history of stroke, diabetes, heart disease, and cancer.
† P < .0001;
‡ P < .01;
‖ P < .05;
§ P < .10.


