
Article Figures & Data
Figures
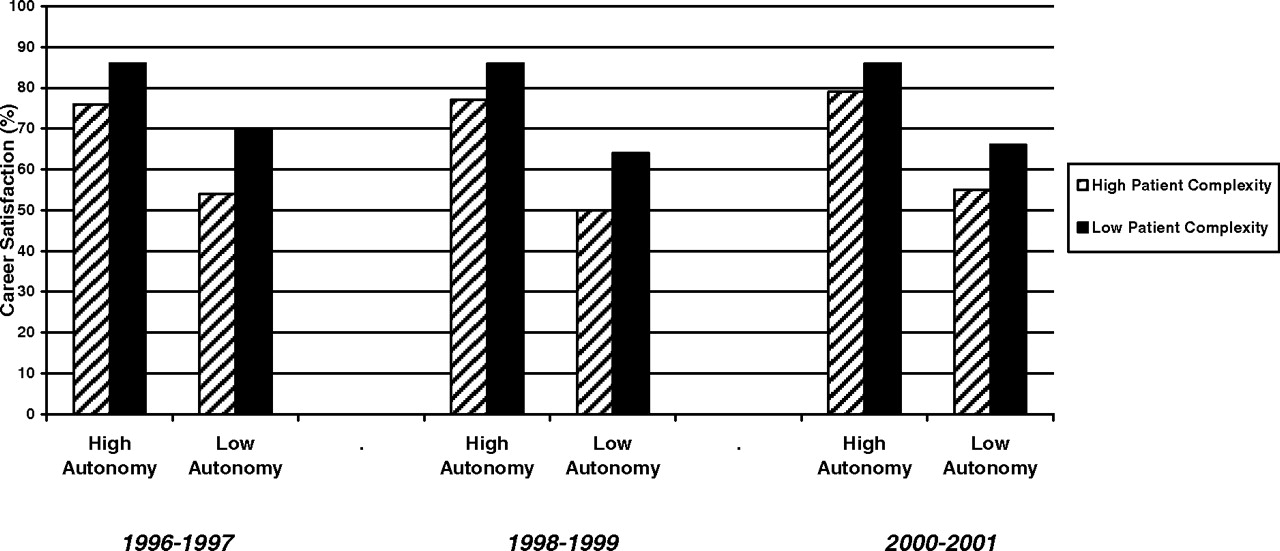
- Figure 1.
Predicted probability of career satisfaction as interaction between patient complexity and perceived autonomy.

Tables
- Table 1.
Characteristics of Primary Care Physicians and Their Practices Included in the Three Waves of the Community Tracking Survey
Characteristic 1996–1997 (n = 7197) 1998–1999 (n = 7264) 2000–2001 (n = 7673) Physician Characteristics (%) Gender (female) 25 29 32 Race (white) — 77 76 Specialty Internal medicine 33 33 33 Family medicine 44 42 43 Pediatrics 23 24 24 Began practice (after 1975) 73 79 84 Salaried 53 55 53 Practice environment Number of practices (% one practice) 92 92 92 Weeks practicing in 1995 (mean ± SD) 47.8 ± 2.7 47.8 ± 2.6 47.7 ± 2.7 Hours per week in direct patient care (mean ± SD) 42.7 ± 12.9 42.2 ± 12.9 44.3 ± 13.1 Type of practice (% solo practice) 25 22 22 Number of physicians at practice (mean ± SD) 26.2 ± 54.6 26.2 ± 54.2 — Number of assistants (mean ± SD) 3.2 ± 5.8 3.2 ± 5.8 — Reimbursement % Medicaid (mean ± SD) 15.0 ± 18.4 15.5 ± 18.5 15.8 ± 18.6 % Medicare (mean ± SD) 27.7 ± 23.0 27.4 ± 22.9 27.9 ± 22.9 % Managed Care (mean ± SD) 47.5 ± 28.2 51.0 ± 27.8 49.4 ± 27.8 Cares for both adults and children (%) 40 39 — Complexity of expected care (% greater than it should be) 24.5 24.8 27.0 Perceived autonomy (% having freedom) 85.8 83.5 86.2 Career satisfaction (% satisfied with career) 80.7 80.0 79.7 Variables Physician Variables Only Physician + Practice Variables Physician + Practice + Effect Variables Physician + Practice + Effect + Perception Variables Physician variables Race (white) — — — — Gender (female) -0.042 (0.077) -0.008 (0.085) -0.003 (0.087) -0.051 (0.089) Salaried 0.392 (0.062)§ 0.001 (0.091) 0.007 (0.092) -0.033 (0.095) Specialty Internal medicine 0.781 (0.293)† 0.835 (0.355)* 0.821 (0.356)* 0.721 (0.387) Family practice 0.963 (0.292)§ 0.872 (0.357)* 0.890 (0.358)* 0.746 (0.390) Pediatrics 1.368 (0.299)§ 1.399 (0.364)§ 1.411 (0.365)§ 1.251 (0.397)‡ Began practice after 1975 0.401 (0.067)§ 0.311 (0.077)§ 0.316 (0.078)§ 0.360 (0.081) Importance of control over decisions (very important) — — — — Practice variables Weeks practicing per year (n) -0.023 (0.013) -0.021 (0.014) -0.018 (0.014) Hours per week in patient care (n) 0.001 (0.003) 0.000 (0.003) 0.002 (0.003) Multiple practices -0.187 (0.121) -0.190 (0.122) -0.120 (0.128) Solo practice -0.676 (0.094)§ -0.681 (0.095)§ -0.678 (0.098)§ No assistants -0.155 (0.078)* -0.144 (0.079) -0.070 (0.082) Frequently obtain high quality services Ancillary Services 0.451 (0.104)§ 0.441 (0.106)§ 0.230 (0.111)* Imaging 0.337 (0.147)* 0.309 (0.150)* 0.184 (0.155) Mental health care 0.241 (0.069)§ 0.245 (0.070)§ 0.120 (0.072) Referrals 0.744 (0.139)§ 0.750 (0.142)§ 0.592 (0.147)§ Revenue From Medicaid (%) 0.001 (0.002) 0.001 (0.002) 0.001 (0.002) From Medicare (%) -0.003 (0.002)* -0.003 (0.002)* -0.004 (0.002)* From managed care (%) -0.007 (0.001)§ -0.006 (0.001)§ -0.006 (0.001)§ Care for adults and children 0.194 (0.165) 0.194 (0.167) 0.198 (0.172) Patients with formulary (%) — — — Effect variables Moderate effect on practice Computer-generated patient data 0.085 (0.072) 0.087 (0.074) Guidelines -0.102 (0.073) -0.030 (0.075) Patient profiles -0.004 (0.075) 0.093 (0.078) Reminders -0.035 (0.075) 0.027 (0.077) Patient surveys -0.065 (0.074) -0.082 (0.076) Computer-generated treatment alternative 0.037 (0.082) 0.025 (0.085) Information Technology (IT) uses (n) — — Perceptions variables Expected complexity -0.683 (0.079)§ Perceived autonomy 0.873 (0.086)§ Χ2 (p) 145.50 (0.000) 360.55 (0.000) 359.97 (0.000) 567.02 (0.000) -2LogL 6890.3 5903.5 5766.9 5486.5 Hosmer-Lemeshow Χ2 (p) 5.13 (0.645) 13.20 (0.105) 9.37 (0.312) 25.79 (0.001) Nagelkerke Adjusted R2 0.032 0.088 0.089 0.140 All data provided as β (SE).
* P ≤ .05.
† P ≤ .01.
‡ P ≤ .005.
§ P ≤ .001.
Variables Physician Variables Only Physician + Practice Variables Physician + Practice + Effects Variables Physician + Practice + Effect + Perception Variables Physician Variables Race (white) 0.259 (0.070)§ 0.209 (0.079)† 0.183 (0.082)* -0.171 (0.085)* Gender (female) 0.000 (0.070) 0.010 (0.079) 0.009 (0.080) 0.061 (0.083) Salaried 0.396 (0.060)§ 0.097 (0.084) 0.110 (0.085) 0.108 (0.088) Specialty Internal medicine 0.609 (0.307)* 0.716 (0.359)* 0.707 (0.360)* 0.775 (0.371)* Family practice 0.865 (0.306)‡ 0.732 (0.360)* 0.767 (0.362)* 0.782 (0.373)* Pediatrics 1.208 (0.311)§ 1.276 (0.368)§ 1.274 (0.370)§ 1.298 (0.381)§ Began practice after 1975 0.291 (0.072)§ 0.349 (0.082)§ 0.351 (0.083)§ 0.331 (0.087)§ Importance of control of decisions (Very Important) — — — — Practice variables Weeks practicing per year (n) -0.032 (0.014)* -0.031 (0.014)* -0.021 (0.014) Hours per week in patient care (n) -0.003 (0.003) -0.003 (0.003) -0.001 (0.003) Multiple practices -0.221 (0.117) -0.196 (0.119) -0.199 (0.123) Solo practice -0.211 (0.094)* -0.188 (0.095)* -0.197 (0.099)* No assistants -0.185 (0.078)* -0.155 (0.080) -0.104 (0.083) Frequently obtain high-quality services Ancillary services 0.418 (0.094)§ 0.419 (0.095)§ 0.253 (0.099)* Imaging 0.647 (0.142)§ 0.602 (0.144)§ 0.406 (0.149)† Mental health care 0.522 (0.070)§ 0.531 (0.070)§ 0.381 (0.073)§ Referrals 0.405 (0.141)‡ 0.414 (0.142)‡ 0.209 (0.146) Revenue From Medicaid (%) 0.002 (0.002) 0.002 (0.002) 0.001 (0.002) From Medicare (%) -0.003 (0.002) -0.004 (0.002)* -0.004 (0.002)* From managed care (%) -0.004 (0.001)‡ -0.004 (0.001)‡ -0.003 (0.001)* Care for adults and children 0.269 (0.165) 0.249 (0.167) 0.305 (0.172) Patients with formulary (%) — — — Effect variables Moderate effect on practice Computer-generated patient data 0.100 (0.070) 0.067 (0.073) Guidelines -0.129 (0.072) -0.090 (0.074) Patient profiles 0.025 (0.075) 0.066 (0.077) Reminders -0.052 (0.073) 0.018 (0.075) Patient surveys -0.016 (0.070) -0.020 (0.073) Computer-generated treatment alternative 0.128 (0.075) 0.162 (0.078)* Information Technology (IT) uses (n) — — Perceptions variables Expected complexity -0.539 (0.078)§ Perceived autonomy 1.029 (0.081)§ Χ2 (p) 146.93 (0.000) 371.54 (0.000) 370.72 (0.000) 614.67 (0.000) -2LogL 7127.1 6079.5 5968.9 5637.2 Hosmer-Lemeshow Χ2 (p) 14.26 (0.075) 11.48 (0.176) 12.35 (0.136) 11.20 (0.191) Nagelkerke Adjusted R2 0.032 0.089 0.090 0.149 All data provided as β (SE).
* P ≤ .05.
† P ≤ .01.
‡ P ≤ .005.
§ P ≤ .001.
Variables Physician Variables Only Physician + Practice Variables Physician + Practice + Effects Variables Physician + Practice + Effect + Perceptions Variables Physician Variables Race (white) 0.080 (0.071) 0.049 (0.080) 0.081 (0.083) 0.069 (0.085) Gender (female) -0.024 (0.068) -0.079 (0.076) -0.083 (0.077) -0.077 (0.079) Salaried 0.341 (0.060)§ 0.056 (0.076) 0.049 (0.077) 0.022 (0.079) Specialty Internal medicine -0.034 (0.331) -0.092 (0.379) -0.076 (0.380) -0.159 (0.395) Family practice 0.143 (0.331) 0.106 (0.378) 0.113 (0.379) 0.048 (0.394) Pediatrics 0.700 (0.336)* 0.732 (0.387) 0.759 (0.387)* 0.653 (0.403) Began practice after 1975 0.103 (0.080) 0.261 (0.091)‡ 0.243 (0.092)† 0.232 (0.094)* Importance of control of decisions (very important) -0.046 (0.066) -0.078 (0.073) -0.068 (0.073) -0.028 (0.075) Practice variables Weeks practicing per year (n) -0.040 (0.013)‡ -0.036 (0.013)† -0.030 (0.014)* Hours per week in patient care (n) -0.011 (0.003)§ -0.011 (0.003)§ -0.010 (0.003)§ Multiple practices -0.168 (0.118) -0.171 (0.119) -0.184 (0.121) Solo practice -0.369 (0.084)§ -0.351 (0.085)§ -0.308 (0.087)§ No assistants — — — Frequently obtain high-quality services Ancillary services 0.444 (0.094)§ 0.446 (0.095)§ 0.267 (0.099)† Imaging 0.284 (0.142)* 0.301 (0.143)* 0.164 (0.147) Mental health care 0.404 (0.070)§ 0.374 (0.070)§ 0.270 (0.072)§ Referrals 0.545 (0.126)§ 0.564 (0.127)§ 0.379 (0.132)‡ Revenue From Medicaid (%) 0.003 (0.002) 0.003 (0.002) 0.003 (0.002) From Medicare (%) -0.002 (0.002) -0.003 (0.002) -0.002 (0.002) From managed care (%) -0.004 (0.001)‡ -0.004 (0.001)‡ -0.003 (0.001)* Care for adults and children — — — Patients with formulary (%) -0.001 (0.002) -0.001 (0.002) -0.001 (0.002) Effect variables Moderate effect on practice Computer-generated patient data — — Guidelines 0.005 (0.071) 0.038 (0.072) Patient profiles -0.047 (0.074) 0.016 (0.076) Reminders — — Patient surveys 0.176 (0.071)* 0.212 (0.073)‡ Computer-generated treatment alternative — — Information Technology (IT) uses (#) 0.026 (0.018) 0.025 (0.019) Perceptions variables Expected complexity -0.437 (0.078)§ Perceived autonomy 0.934 (0.085)§ Χ2 (p) 118.04 (0.000) 345.96 (0.000) 352.36 (0.000) 516.59 (0.000) -2LogL 7251.3 6198.6 6108.4 5855.8 Hosmer-Lemeshow Χ2 (p) 3.69 (0.884) 13.54 (0.095) 5.84 (0.665) 6.88 (0.549) Nagelkerke Adjusted R2 0.025 0.081 0.083 0.122 All data provided as β (SE).
* P ≤ .05.
† P ≤ .01.
‡ P ≤ .005.
§ P ≤ .001.
In this issue


Jump to section
Related Articles
Cited By...
- Advanced practice nursing: Qualitative study of implications for family physicians perceptions of their own work
- Visit Planning Using a Waiting Room Health IT Tool: The Aligning Patients and Providers Randomized Controlled Trial
- The Full Scope of Family Physicians Work Is Not Reflected by Current Procedural Terminology Codes
- Staff perceptions of community health centre team function in Ontario
- Satisfaction of Family Physicians Working in Community Health Centers
- An Empirical Investigation of Factors Influencing Career Satisfaction of Primary Care Physicians
- A Method for Estimating Relative Complexity of Ambulatory Care
- Optimism: A Good Theme for Family Medicine