
Article Figures & Data
Figures
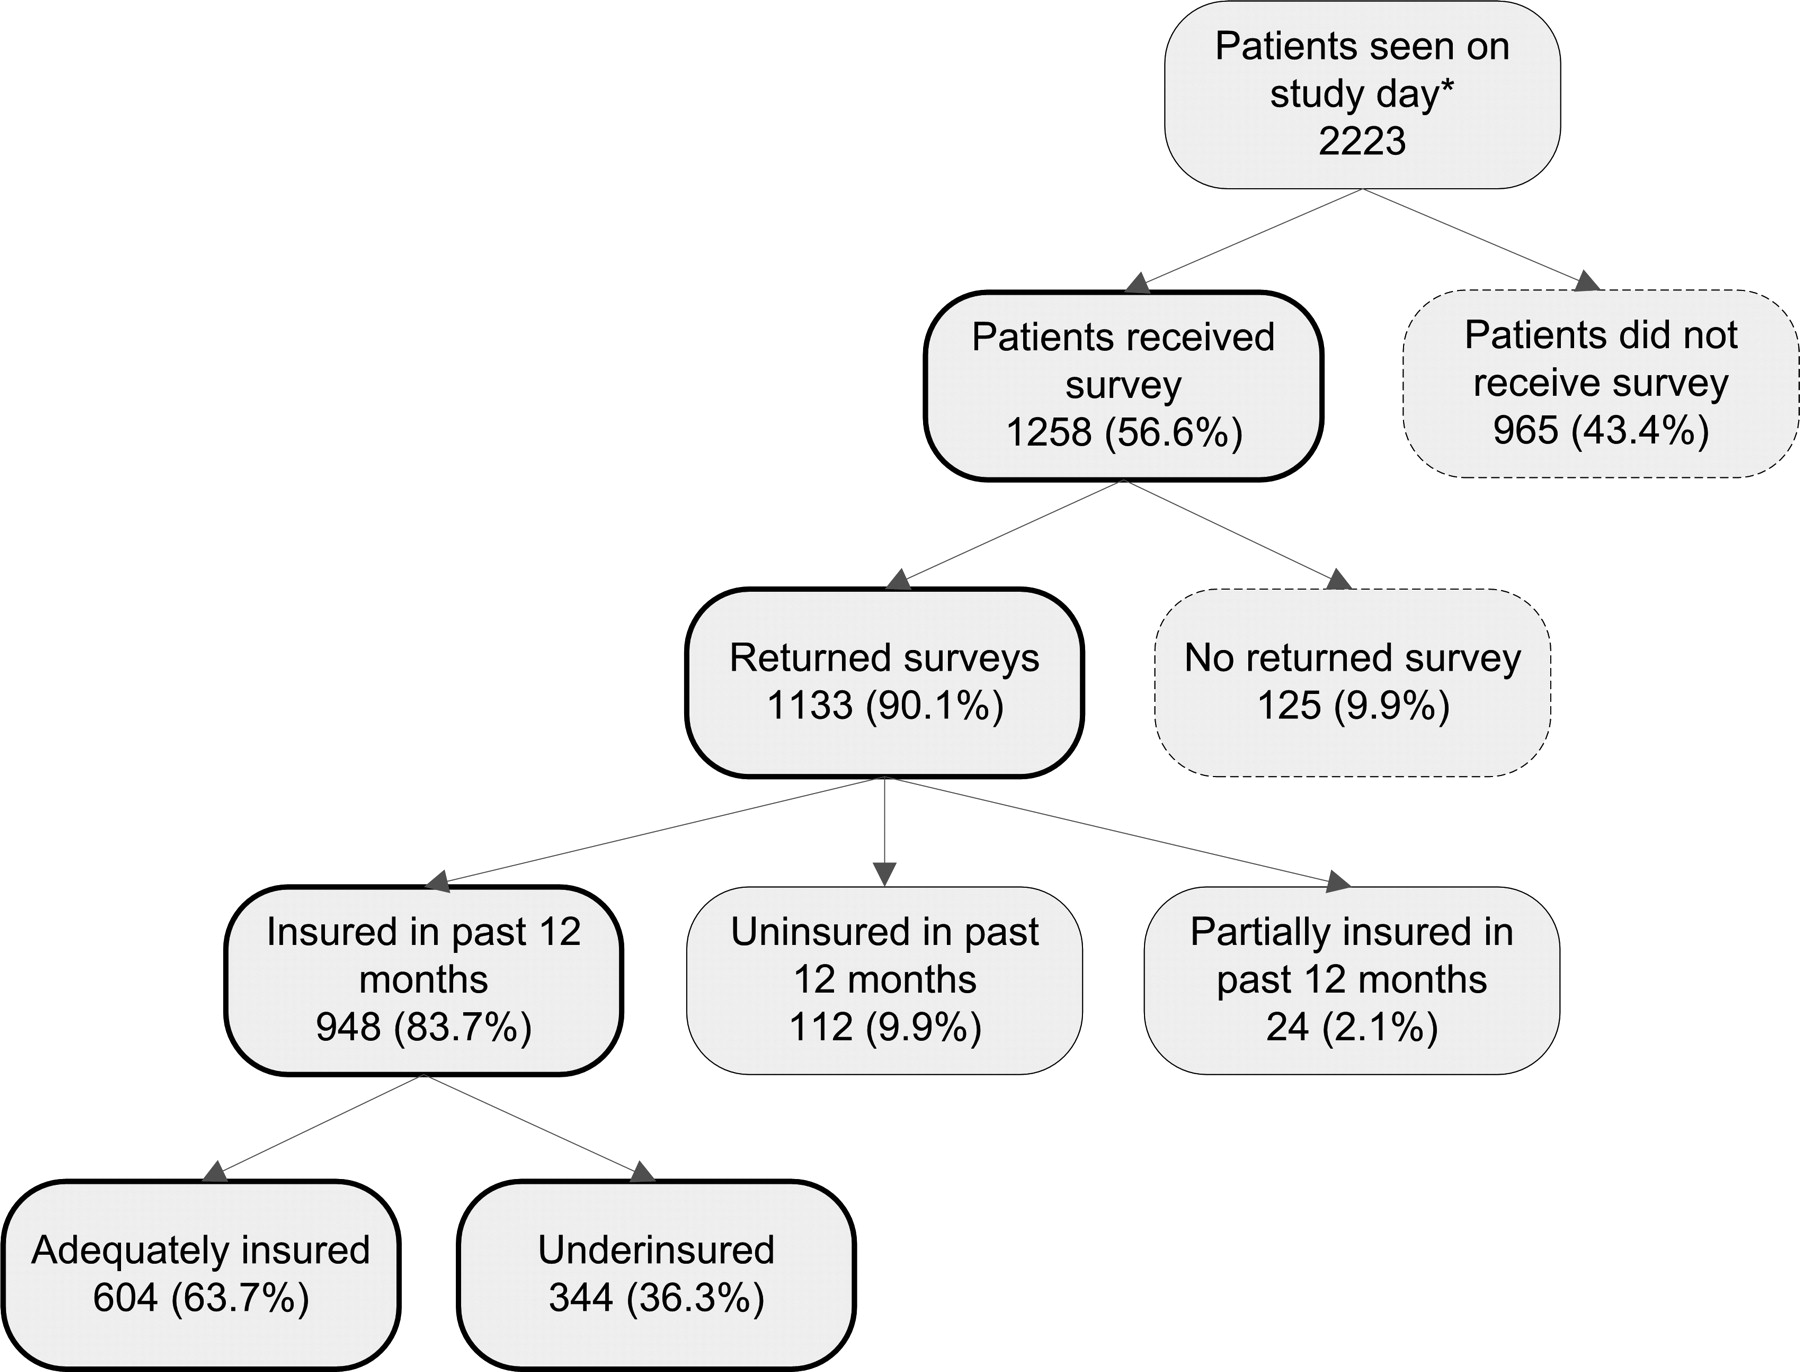
- Figure 1.
Survey response diagram and underinsured sample. *Total number of patients seen on the study day was recorded by each practice except one small practice which provided an average daily patient count (40 patients per day).

Tables
Stratum Definition Uninsured Patient marked “no insurance” during the past 12 months Partially insured Patient marked “no insurance” and at least one other type of insurance during the past 12 months Adequately insured Patient marked at least one type of insurance during the past 12 months and marked “no” or “don't know” for all indicators of underinsurance Underinsured Patient marked at least one type of insurance during the past 12 months and marked “yes” for at least one indicator of underinsurance Characteristic N (%)* Family medicine 30 (81.1) Internal medicine 4 (10.8) Pediatrics 2 (5.4) Geriatrics 1 (2.7) Urban/suburban 21 (56.8) Rural 16 (43.2) Community health center 11 (29.7) Private practice 11 (29.7) Hospital affiliate 10 (27.0) Residency practice 5 (13.5) * Totals may not equal 100% because of rounding.
Characteristic N (%) Age (years) ≤17 113 (10.0) 8–39 424 (37.4) 40–64 390 (34.4) ≥65 206 (18.2) Sex Male 285 (25.2) Female 615 (54.3) Unknown 233 (20.6) Race/ethnicity White (non-Hispanic) 672 (59.3) African-American (non-Hispanic) 60 (5.3) Other (non-Hispanic) 48 (4.2) Hispanic 317 (28.0) Unknown 36 (3.2) Income <$25,000 522 (46.1) $25,000–$49,999 220 (19.4) ≥$50,000 239 (21.1) Unknown 152 (13.4) General health status Good, very good, or excellent 734 (64.8) Fair or poor 342 (30.2) Unknown 57 (5.0) Insurance Type Medicare only 86 (7.6) Medicaid only 193 (17.0) Private only 213 (18.8) All others 480 (42.4) No insurance 112 (9.9) Missing 49 (4.3) - Table 4.
Demographic Characteristics of Underinsured Patients Compared with Those of Adequately Insured Patients*
Characteristic Insured Uninsured (n = 112) Underinsured (n = 344) Adequately insured (n = 604) Age† ≤17 22 (6.4) 57 (9.4) 7 (6.3) 18–39 166 (48.3) 176 (29.1) 57 (50.9) 40–64 130 (37.8) 197 (32.6) 45 (40.2) ≥65 26 (7.6) 174 (28.8) 3 (2.7) Insured Patients 344 (36.3) 604 (63.7) Sex† Male 66 (19.2) 158 (26.2) 63 (56.3) Female 228 (66.3) 296 (49.0) 25 (22.3) Unknown 50 (14.5) 150 (24.8) 24 (21.4) Race/ethnicity† White (non-Hispanic) 189 (54.9) 411 (68.1) 46 (41.1) African-American (non-Hispanic) 27 (7.9) 22 (3.6) 7 (6.3) Other (non-Hispanic) 12 (3.5) 31 (5.1) 4 (3.6) Hispanic 112 (32.6) 134 (22.2) 55 (49.1) Unknown 4 (1.2) 6 (1.0) 0 (0) Income† <$25,000 184 (53.5) 230 (38.1) 79 (70.5) $25,000–$49,999 87 (25.3) 111 (18.4) 12 (10.7) ≥$50,000 51 (14.8) 179 (29.6) 5 (4.5) Unknown 22 (6.4) 84 (13.9) 16 (14.3) Health suffered from inability to get care because of cost† Yes 173 (50.3) 8 (1.3) 52 (46.4) No/don't know 156 (45.3) 577 (95.5) 52 (46.4) Unknown 15 (4.4) 19 (3.2) 8 (7.1) General health status† Good, very good, or excellent 202 (58.7) 445 (73.7) 54 (48.2) Fair or poor 134 (39.0) 136 (22.5) 53 (47.3) Unknown 8 (2.3) 23 (3.8) 5 (4.5) Insurance Type Medicare only 28 (8.1) 58 (9.6) Medicaid only 83 (24.1) 110 (18.2) Private only 73 (21.2) 140 (23.2) All others 160 (46.5) 296 (49.0) All values shown as n (%).
* Does not include the partially insured (those who had insurance but not for the entire year, which was an additional 73 patients).
† P < .01 for unadjusted χ2 test. Analysis for this table did not adjust for practice as a random effect.
- Table 5.
Underinsured Versus Adequately Insured: Odds Ratios of Being Underinsured by Patient Demographic and Insurance Characteristics
Demographic Variable Underinsured Versus Adequately Insured (n = 948) Odds Ratio (95% CI) P Sex Female 2.25 (1.56–3.24) Unknown 1.28 (0.80–2.05) <.001 Male 1.00 (1.00–1.00) Age ≤17 2.51 (1.31–4.81) 18–39 6.18 (3.86–9.92) <.001 40–64 4.39 (2.74–7.04) ≥65 1.00 (1.00–1.00) Race/ethnicity* African-American (non-Hispanic) 2.63 (1.44–4.83) Hispanic 1.76 (1.26–2.45) .001 Other (non-Hispanic) 0.84 (0.42–1.69) White (non-Hispanic) 1.00 (1.00–1.00) Rural Yes 0.85 (0.56–1.29) .462 No 1.00 (1.00–1.00) Annual income <$25,000 2.70 (1.85–3.94) $25,000–$49,999 2.69 (1.76–4.10) <.001 Missing 0.92 (0.52–1.62) ≥$50,000 1.00 (1.00–1.00) General health status Poor/fair 2.15 (1.59–2.89) Missing 0.85 (0.37–1.94) <.001 Good/excellent 1.00 (1.00–1.00) I pay or a family member pays for my insurance Yes 1.01 (0.76–1.34) .967 No 1.00 (1.00–1.00) My employer or a family member's employer pays for my insurance Yes 0.65 (0.46–0.90) .010 No 1.00 (1.00–1.00) Government pays for my insurance Yes 0.95 (0.72–1.26) .722 No 1.00 (1.00–1.00) Health suffered from inability to get care because of cost* Yes 79.21 (38.34–163.64) <.001 No/don't know 1.00 (1.00–1.00) Medicaid Yes 1.21 (0.89–1.64) .219 No 1.00 (1.00–1.00) Medicare Yes 0.47 (0.34–0.64) <.001 No 1.00 (1.00–1.00) * Bolded values indicate statistical association at α = 0.01.
Note: Estimated odds ratio and 95% CI are large when underinsured versus insured respondents are compared. This is because of the small number of insured respondents (n = 8) who reported that their health suffered because of high costs.
In this issue


Jump to section
Related Articles
Cited By...
- Impact of Health Insurance Patterns on Chronic Health Conditions Among Older Patients
- Parents Report of Their Childrens Underinsurance Status After the Affordable Care Act
- Insurance Status Among Adults With Hypertension--The Impact of Underinsurance
- Underinsurance Before the Implementation of the Affordable Care Act: From the Research Involving Outpatient Settings Network (RIOS Net)
- Diabetes Care Quality Is Highly Correlated With Patient Panel Characteristics
- Receipt of Diabetes Preventive Care Among Safety Net Patients Associated with Differing Levels of Insurance Coverage
- Card Studies for Observational Research in Practice
- Third Journal of the American Board of Family Medicine Practice-based Research Theme Issue