
Article Figures & Data
Figures
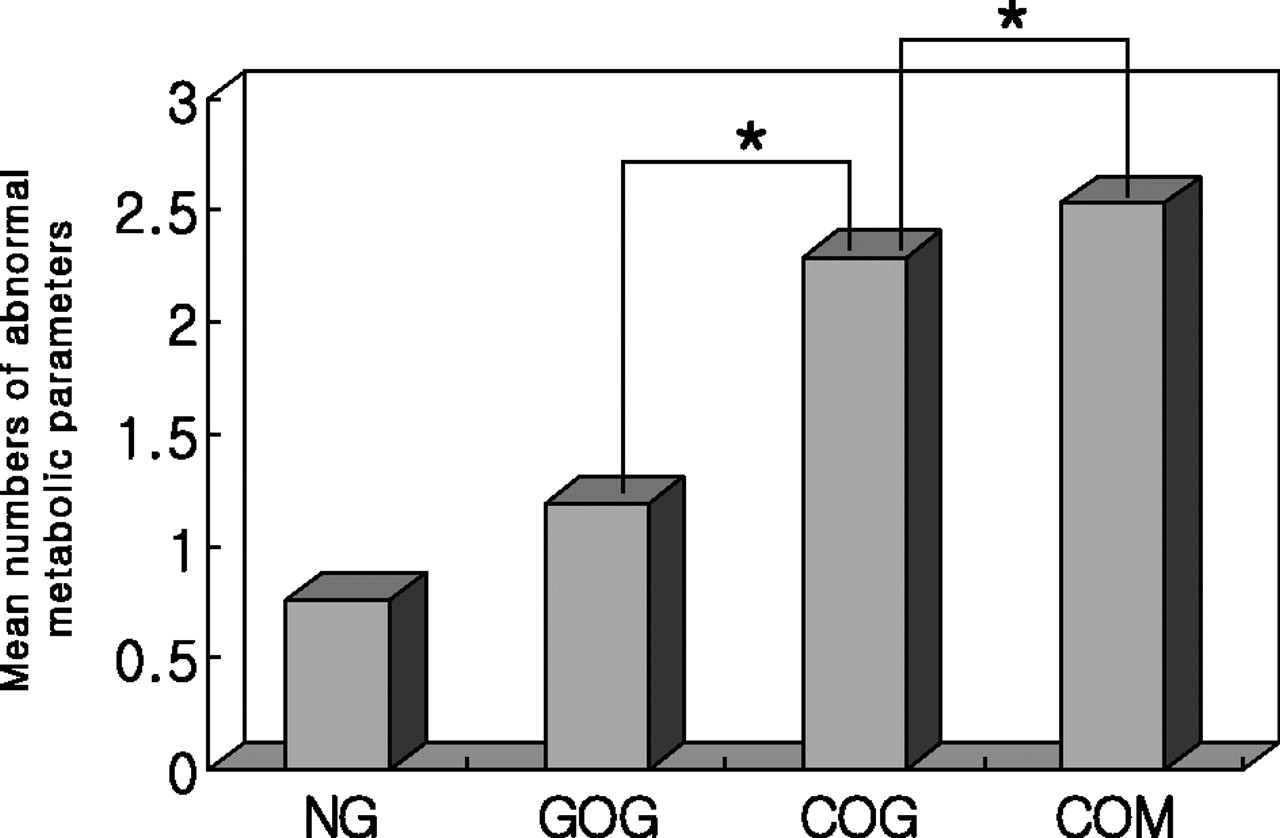
- Figure 1.
Mean values for abnormal metabolic parameters for men in the normal group (NG), generally obese group (GOG), centrally obese group (COG), and combined obese group (COM): 3rd National Cholesterol Education Program-Adults Treatment Panel III (NCEP-ATP III) Asian guideline. ∗, P > .05, statistically significant difference between groups.
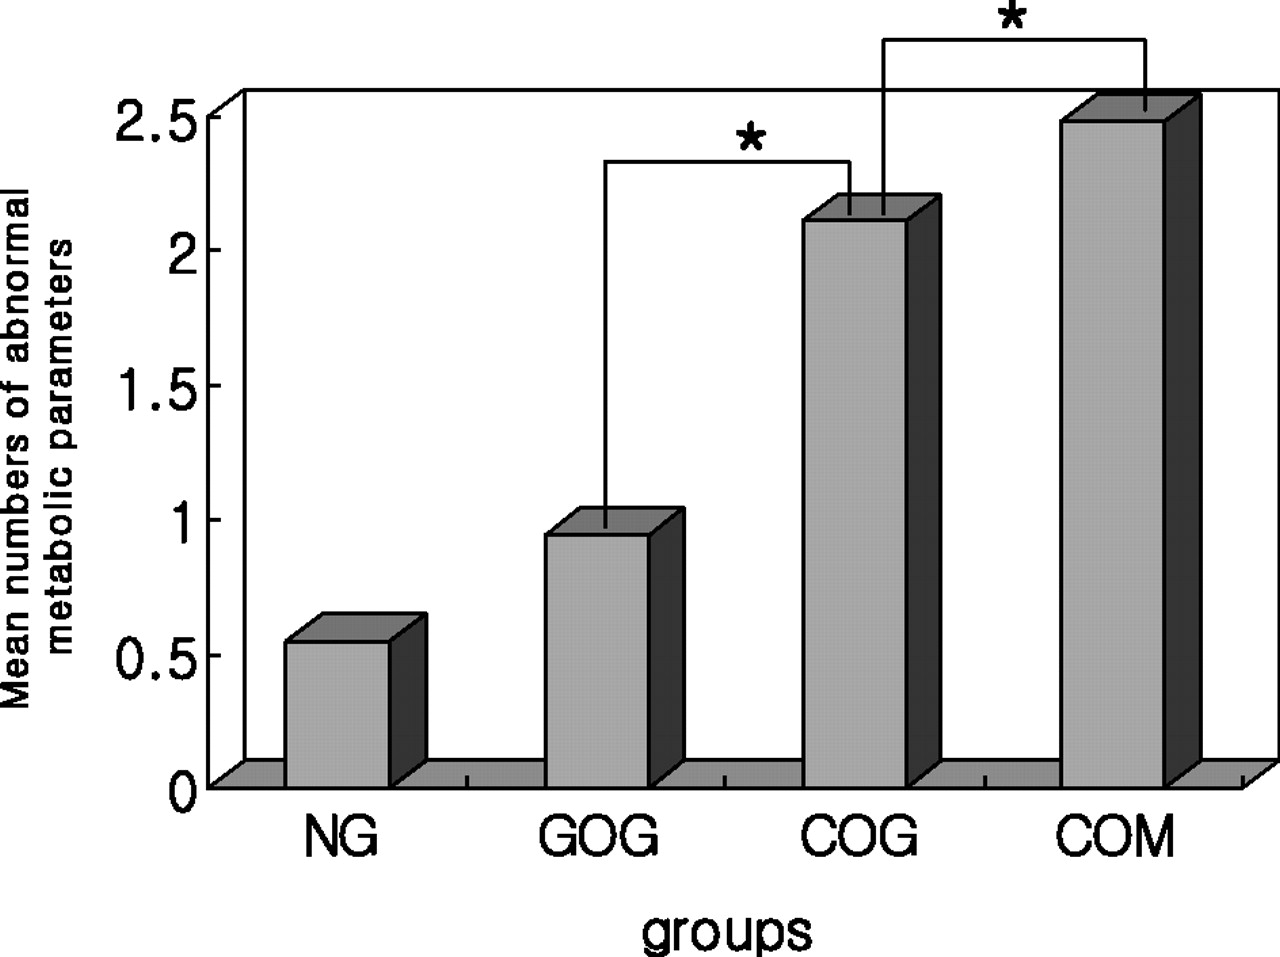
- Figure 2.
Mean values for abnormal metabolic parameters for women in the normal group (NG), generally obese group (GOG), centrally obese group (COG), and combined obese group (COM): 3rd National Cholesterol Education Program-Adults Treatment Panel III (NCEP-ATP III) Asian guideline. ∗, P > .05, statistically significant difference between groups.


Tables
NG (n = 43,710, 62.9%) COG (n = 3925, 5.6%) GOG (n = 7597, 10.9%) COM (n =14,303, 20.6%) P Value* Age (years) Male 44.1 ± 9.9 49.5 ± 10.1 43.6 ± 8.7 45.7 ± 9.5 <.001 Female 41.8 ± 10.0 50.8 ± 10.8 45.3 ± 9.6 50.9 ± 10.3 <.001 Smoking (pack/year) Male 14.0 ± 13.9 19.2 ± 17.7 13.3 ± 13.4 16.5 ± 16.0 <.001 Female 0.4 ± 2.4 0.5 ± 3.1 0.1 ± 1.5 0.4 ± 2.7 <.001 Weight (kg) Male 63.7 ± 6.6 71.7 ± 5.0 73.4 ± 5.1 80.2 ± 7.4 <.001 Female 52.9 ± 5.3 58.2 ± 4.7 62.2 ± 4.4 66.9 ± 6.8 <.001 Waist (cm) Male 79.8 ± 5.6 91.6 ± 1.9 86.0 ± 2.6 94.5 ± 4.2 <.001 Female 70.3 ± 5.0 82.8 ± 3.0 76.3 ± 2.4 86.8 ± 5.7 <.001 BMI (kg/m2) Male 22.1 ± 1.8 24.0 ± 0.7 25.9 ± 0.9 27.5 ± 1.8 <.001 Female 21.3 ± 1.9 23.5 ± 1.1 25.9 ± 0.9 29.6 ± 2.2 <.001 All values are mean ± SD by ANOVA test with post hoc analysis. NG, normal group (normal BMI with normal WC); COG, centrally obese group (normal BMI with high WC); GOG, generally obese group (high BMI with normal WC); COM, combined obese group (high BMI and high WC); BMI, body mass index.
* P value by general linear model with age and smoking amount adjustment among groups.
NG (n = 24,215, 60.5%) COG (n = 1538, 3.9%) GOG (n = 5730, 14.3%) COM (n = 8527, 21.3%) P Value* TC (mg/dL) 188.4 ± 33.5 200.4 ± 34.0 198.3 ± 33.9 201.7 ± 33.9† <.001 HDL-C (mg/dL) 50.3 ± 11.8 47.0 ± 10.9‡ 46.4 ± 9.7† 45.0 ± 9.4 <.001 TG (mg/dL) 131.3 ± 76.6 172.8 ± 91.9§ 165.7 ± 89.7 189.2 ± 101.1†‡ <.001 Glucose (mg/dL) 99.4 ± 22.6 106.4 ± 26.6§ 102.6 ± 20.8 106.2 ± 23.3† <.001 LDL-C (mg/dL) 111.7 ± 30.6 118.8 ± 32.7 118.7 ± 31.0 118.8 ± 32.4 <.001 s-BP (mm Hg) 118.8 ± 15.5 124.7 ± 16.2 125.1 ± 15.6 129.1 ± 15.7†‡ <.001 d-BP (mm Hg) 74.0 ± 10.9 78.0 ± 10.7 78.0 ± 11.3 80.9 ± 11.3†‡ <.001 All values are mean ± SD. NG, normal group (normal BMI with normal WC); COG, centrally obese group (normal BMI with high WC); GOG, generally obese group (high BMI with normal WC); COM, combined obese group (high BMI and WC); TC, total cholesterol; HDL-C, high-density lipoprotein cholesterol; TG, triglyceride; LDL-C, low-density lipoprotein cholesterol; s-BP, systolic blood pressure; d-BP, diastolic blood pressure.
†, ‡, and § are marked in groups with higher values and P < .05 by ANOVA test.
* P value by general linear model with age and smoking amount adjustment among groups.
† Comparison between GOG and COM.
‡ Comparison between COG and COM.
§ Comparison between COG and GOG.
NG (n = 19,495, 66.0%) COG (n = 2387, 8.1%) GOG (n = 1867, 6.3%) COM (n = 5776, 19.6%) P Value* TC (mg/dL) 182.5 ± 34.0 198.8 ± 37.7† 95.2 ± 35.0 203.1 ± 37.0‡§ <.001 HDL-C (mg/dL) 57.5 ± 12.8 53.8 ± 12.8§ 53.6 ± 11.8‡ 51.3 ± 11.5 <.001 TG (mg/dL) 94.0 ± 53.9 129.5 ± 77.8† 119.0 ± 70.0 145.5 ± 82.7‡§ <.001 Glucose (mg/dL) 93.4 ± 14.3 101.1 ± 26.1† 97.2 ± 17.1 104.4 ± 26.3‡§ <.001 LDL-C (mg/dL) 106.1 ± 29.7 119.0 ± 33.7 117.7 ± 31.6 122.6 ± 33.6‡§ <.001 s-BP (mm Hg) 110.7 ± 16.4 121.1 ± 19.4 120.5 ± 18.3 129.1 ± 19.2‡§ <.001 d-BP (mm Hg) 70.2 ± 10.1 74.6 ± 11.1 74.6 ± 11.2 79.0 ± 11.4‡§ <.001 All values are mean ± SD. NG, normal group (normal BMI with normal WC); COG, centrally obese group (normal BMI with high WC); GOG, generally obese group (high BMI with normal WC); COM, combined obese group (high BMI and WC); TC, total cholesterol; HDL, high-density lipoprotein cholesterol; TG, triglyceride; LDL, low-density lipoprotein cholesterol; s-BP, systolic blood pressure; d-BP, diastolic blood pressure.
†, ‡, and § are marked in groups with higher values and P < .05 by ANOVA test.
* P value by general linear model with age and smoking amount adjustment among groups.
† Comparison between COG and GOG.
‡ Comparison between GOG and COM.
§ Comparison between COG and COM.
Men Women FBG ≥110 mg/dL,OR (95% CI) TG ≥150 mg/dL,OR (95% CI) P Value* FBG ≥110 mg/dL,OR (95% CI) TG ≥150 mg/dL,OR (95% CI) P Value* NG 1 1 1 1 COG 1.82 (1.59–2.09) 2.38 (2.13–2.67) <.001 1.91 (1.65–2.21) 2.01 (1.80–2.25) <.001 GOG 1.74 (1.60–1.89) 2.20 (2.06–2.34) <.001 1.77 (1.48–2.11) 1.96 (1.73–2.22) <.001 COM 2.35 (2.20–2.52) 3.26 (3.08–3.44) <.001 3.20 (2.89–3.54) 3.05 (2.82–3.30) <.001 FBG, fasting blood sugar; TG, triglyceride; NG, normal group (normal BMI with normal WC); COG, centrally obese group (normal BMI with high WC); GOG, generally obese group (high BMI with normal WC); COM, combined obese group (high BMI and WC); OR, odds ratio; CI, confidence interval.
* P < .001, statistically significant difference compared to the NG after age and smoking amount adjustment by the multiple logistic regression model.
- Table 5.
Prevalence of Abnormal Metabolic Parameters and Metabolic Syndrome for Men in the NG, COG, GOG, and COM Groups.
NG (%) COG (%) GOG (%) COM (%) P Value Waist (≥90 cm) 0 100 0 100 <.001 HDL-C (<40 mg/dL) 16.7 23.9 24.7 29.5 <.001 TG (≥150 mg/dL) 29.7 51.7 47.5 58.3 <.001 FBG (≥110 mg/dL) 12.3 24.0 18.6 26.3 <.001 BP (≥130/80 mm Hg) 35.6 52.0 50.5 63.4 <.001 MS (%) 4.2 39.1 9.7 49.7 <.001 NG, normal group (normal BMI with normal WC); COG, centrally obese group (normal BMI with high WC); GOG, generally obese group (high BMI with normal WC); COM, combined obese group (high BMI and WC); HDL-C, high-density lipoprotein cholesterol; TG, triglyceride; FBG, fasting blood glucose; BP, blood pressure; MS, metabolic syndrome defined in NCEP-ATP III (Asian guideline). P values were from χ2 test.
- Table 6.
Prevalence of Abnormal Metabolic Parameters and Metabolic Syndrome for Women in the NG, COG, GOG, and COM Groups
NG (%) COG (%) GOG (%) COM (%) P Value Waist (≥80 cm) 0 100 0 100 <.001 HDL-C (<50 mg/dL) 2.8 39.9 39.5 48.5 <.001 TG (≥150 mg/dL) 11.5 28.4 23.1 37.2 <.001 Glucose (≥110 mg/dL) 4.9 14.3 9.7 21.3 <.001 BP (≥130/80 mm Hg) 21.4 42.9 37.7 57.9 <.001 MS (%) 2.6 33.0 7.8 46.5 <.001 NG, normal group (normal BMI with normal WC); COG, centrally obese group (normal BMI with high WC); GOG, generally obese group (high BMI with normal WC); COM, combined obese group (high BMI and WC); HDL-C, high-density lipoprotein cholesterol; TG, triglyceride; BP, blood pressure; MS, metabolic syndrome defined in NCEP-ATP III (Asian guideline). P values were from χ2 test.


Jump to section
Related Articles
Cited By...
- No citing articles found.