
Article Figures & Data
Figures
- Figure 1.
Composition of Final Study Sample.
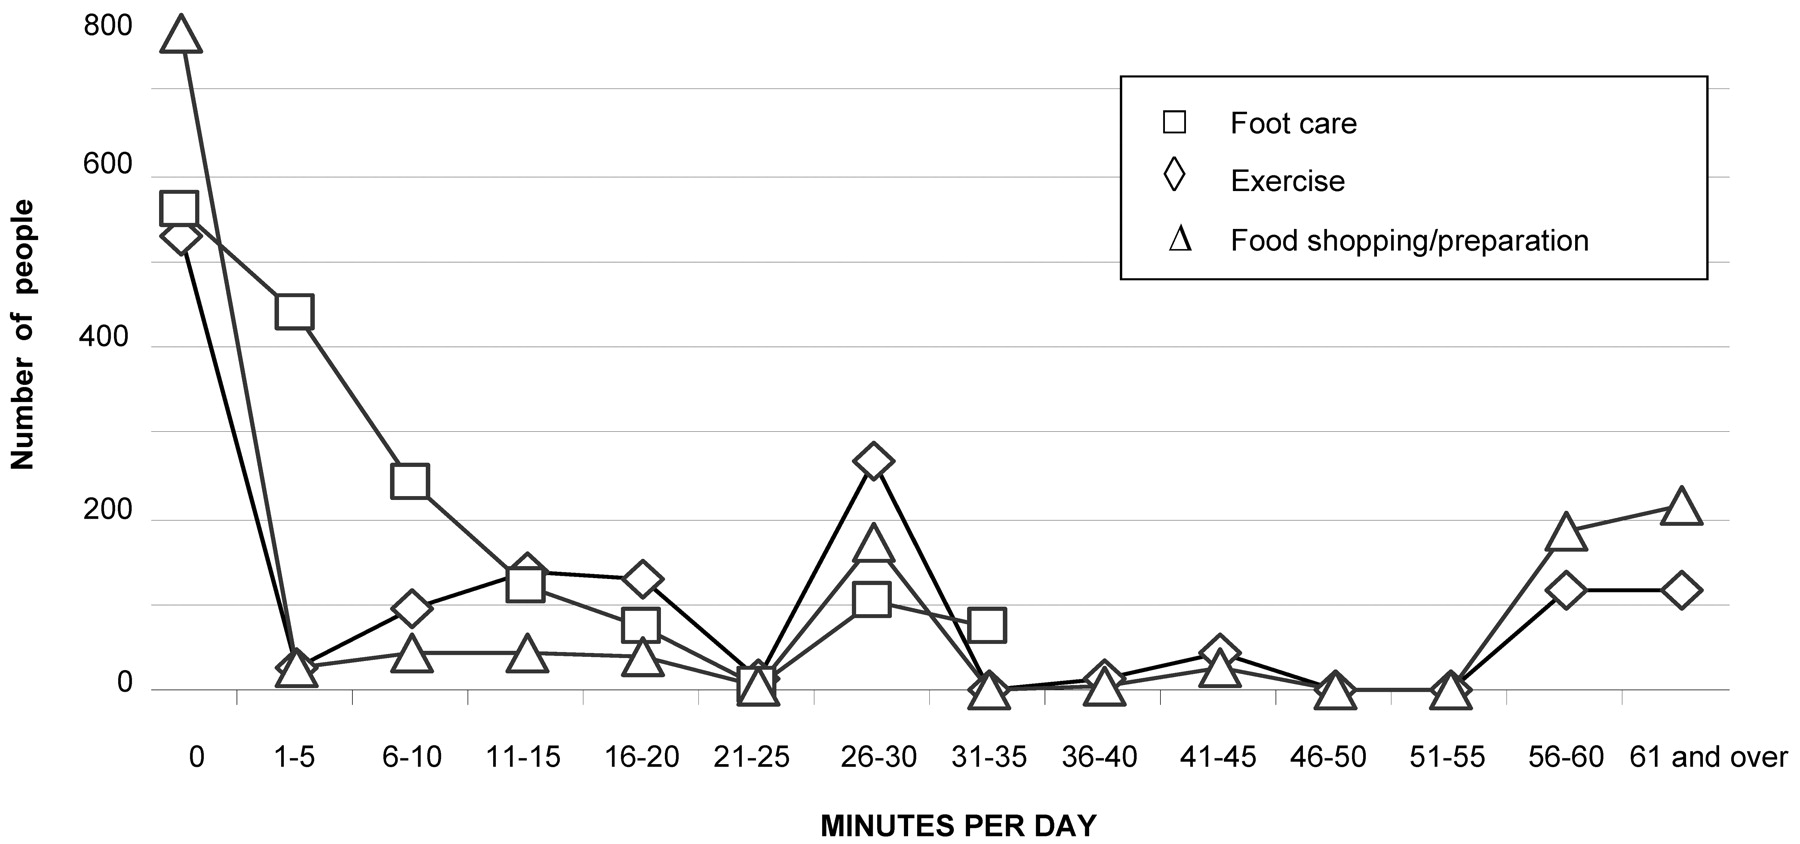
- Figure 2.
Number of People Reporting Various Times Spent on Foot Care, Exercise, and Food Shopping/Preparation, Minutes per Day.


Tables
- Table 1.
Demographic Characteristics of 1482 Persons with Diabetes and Time Spent on Foot Care, Exercise, Food Preparation, and in Total Self-Care
Characteristic (%)* Foot Care Exercise Shopping and Cooking Total Time Spent† % Not Engaging‡ Mean Non-Zero Time, min/day (25%, 75%) % Not Engaging Mean Non-Zero Time, min/day (25%, 75%) % Not Engaging Mean Non-Zero Time, min/day (25%, 75%) Mean min/day (25%, 75%) All Patients 37.9 13 (5, 15) 37.7 32 (15, 38) 54.4 48 (30, 60) 58 (19, 84) Age, years <45 (15.1%) 35.9 10 (5, 15)§ 37.7 33 (15, 38)§ 51.2 44 (20, 60)§ 56 (21, 77) 45 to 54 (27.0%) 39.6 12 (5, 15)§ 34.8 33 (15, 40)§ 53.0 44 (20, 60)§ 60 (21, 87) 55 to 64 (32.2%) 37.9 13 (5, 15)§ 37.5 34 (20, 45)§ 57.5 47 (20, 60)§ 58 (19, 80) >65 (25.7%) 37.2 17 (5, 30)§ 41.0 28 (15, 30)§ 54.1 55 (30, 60)§ 58 (15, 89) Sex Female (51.6%) 32.3§ 14 (5, 20) 40.7§ 29 (15, 30)§ 46.0§ 51 (30, 60)§ 63 (22, 90)§ Male (48.3%) 43.8§ 13 (5, 15) 34.4§ 35 (15, 45)§ 63.6§ 42 (15, 60)§ 53 (15, 75)§ Education <High school (52.6%) 35.8§ 15 (5, 20)§ 41.5§ 31 (15, 30) 51.8§ 52 (30, 60)§ 60 (19, 89)§ Some college (25.5%) 35.5§ 13 (5, 15)§ 34.9§ 33 (18, 45) 53.9§ 46 (20, 60)§ 59 (20, 82)§ >4 years college (21.4%) 45.3§ 9 (5, 10)§ 31.7§ 33 (15, 45) 61.6§ 38 (15, 60)§ 52 (18, 73)§ Ethnicity African American (36.2%) 29.9§ 17 (5, 20)§ 36.6 32 (15, 30) 49.4§ 52 (30, 60)§ 65 (22, 95)§ White (47.0%) 43.1§ 10 (5, 10)§ 37.4 33 (15, 45) 60.9§ 39 (15, 60)§ 51 (16, 74)§ Others (13.4%) 40.9§ 14 (5, 15)§ 42.1 31 (15, 30) 44.8§ 55 (30, 60)§ 65 (24, 93)§ * Percentage of the total study sample (n = 1482) with this characteristic. For example, 36.2% of the sample was African American.
† Total time spent is for the 3 listed elements plus self-testing and insulin injection (see text).
‡ Percentage of the individuals with each characteristic that did not engage in this activity. For example, 29.9% of African Americans did not engage in foot care.
§ P <.05.
- Table 2.
Clinical Characteristics of 1482 Persons with Diabetes and Time Spent in Foot Care, Exercise, Shopping and Cooking, and in Total Self-Care
Characteristic (%)* Foot Care Exercise Shopping and Cooking Total Time Spent† % Not Engaging‡ Mean Non-Zero Time, min/day (25%, 75%) % Not Engaging Mean Non-Zero Time, min/day (25%, 75%) % Not Engaging Mean Non-Zero Time, min/day (25%, 75%) Mean min/day (25%, 75%) All patients 37.9 13 (5, 15) 37.7 32 (15, 38) 54.4 48 (30, 60) 58 (19, 84) BMI, kg/m2 <30 (46.3%) 38.3 13 (5, 15) 32.6§ 34 (15, 45) 53.9 46 (25, 60) 59 (20, 85) 30 to 34 (27.6%) 39.5 14 (5, 20) 35.2§ 32 (15, 38) 54.9 47 (30, 60) 59 (22, 89) 35 to 40 (14.5%) 36.9 14 (5, 20) 46.8§ 31 (15, 45) 49.8 49 (25, 60) 57 (15, 85) >40 (11.5%) 33.5 12 (5, 15) 52.4§ 26 (15, 30) 61.0 52 (30, 60) 51 (15, 74) Neuropathy symptoms‖ Most (13.5%) 24.1§ 16 (5, 20)§ 38.1§ 33 (15, 45) 46.3§ 46 (20,60) 66 (30, 89)§ Moderate (14.2%) 30.1§ 17 (5, 20)§ 46.2§ 33 (15, 30) 48.5§ 53 (30, 60) 63 (20, 94)§ Mild (21.9%) 35.9§ 13 (5, 15)§ 33.6§ 29 (15, 30) 52.8§ 45 (30, 60) 58 (19, 85)§ None (44.5%) 45.5§ 11 (5, 15)§ 37.2§ 33 (15, 45) 59.7§ 44 (20, 60) 53 (15, 77)§ Diabetes treatment Diet only (5.5%) 42.0§ 14 (5, 15) 34.2 29 (18, 30) 40.3§ 46 (20, 60) 55 (16, 80)§ Oral only (63.4%) 41.9§ 13 (5, 15) 38.8 33 (15, 45) 57.4§ 48 (30, 60) 55 (15, 79)§ Insulin (31.1%) 29.0§ 14 (5, 15) 35.9 32 (15, 30) 50.6§ 46 (30, 60) 66 (24, 90)§ Self-testing Never (20.8%) 50.2§ 12 (5, 15) 47.3§ 29 (15, 30) 60.4§ 50 (20, 60) 42 (4, 64)§ <1/day (27.0%) 42.1§ 13 (5, 15) 43.0§ 31 (15, 30) 55.8§ 45 (20, 60) 47 (9, 68)§ 1/day (12.3%) 35.2§ 14 (5, 15) 33.5§ 35 (20, 60) 53.9§ 48 (20, 60) 66 (23, 87)§ >2/day (39.8%) 29.4§ 14 (5, 15) 30.5§ 33 (15, 40) 50.5§ 48 (30, 60) 71 (35, 95)§ Others (13.4%) 40.9§ 14 (5, 15)§ 42.1 31 (15, 30) 44.8§ 55 (30, 60)§ 65 (24, 93)§ * Percentage of the total study sample (n = 1482) with this characteristic. For example, 31.1% of the sample used insulin.
† Total time spent is for the three listed elements plus self-testing and insulin injection (see text).
‡ Percentage of individuals with each characteristic that did not engage in this activity. For example, 29.0% of insulin-users did not engage in foot care.
‖ Based on foot neuropathy symptom score (see text). Most symptoms = 3 to 10; moderate = 11 to 12; mild = 13 to 14; none = 15.
§ P <.05.
- Table 3.
Adjusted Odds Ratios* and 95% CI for Spending Any Time Daily on Foot Care, Exercise, and Food Shopping/Preparation
Contrast Foot Care Exercise Food Shopping/Preparation Sex: male vs female 0.7 (0.5, 0.9)† 1.1 (0.9, 1.5) 0.5 (0.4, 0.7) Body mass index (kg/m2) >40 vs 30 to 34 1.1 (0.7, 1.6) 0.5 (0.4, 0.9) 0.7 (0.4, 1.0) 35 to 40 vs 30 to 34 1.1 (0.7, 1.6) 0.6 (0.4, 0.9) 1.4 (1.0, 2.1) Amputees vs non-amputees 4.7 (1.3, 16.4) 1.3 (0.6, 3.0) 2.2 (1.0, 5.0) Foot neuropathy: no symptoms vs most 0.5 (0.4, 0.8) 1.1 (0.7, 1.6) 0.7 (0.5, 1.1) Physical functioning: best vs worst quartile 0.7 (0.4, 1.0) 1.3 (0.9, 2.0) 0.8 (0.5, 1.3) Mental functioning: best vs worst quartile 1.0 (0.6, 1.4) 1.2 (0.8, 1.7) 0.7 (0.5, 4.0) Self-testing Never vs ≥2 times daily 0.4 (0.3, 0.6) 0.4 (0.3, 0.6) 0.7 (0.5, 1.0) Rarely (<daily) vs >2 times daily 0.5 (0.4, 0.7) 0.5 (0.4, 0.7) 0.9 (0.6, 1.2) Race/ethnicity Whites vs African Americans 0.5 (0.4, 0.7) 0.7 (0.5, 1.0) 0.7 (0.5, 0.9) Other races vs African Americans 0.6 (0.4, 0.9) 0.6 (0.4, 0.9) 1.1 (0.8, 1.7) * Each column presents adjusted odds ratios from a separate logistic regression model that also included age, sex, body mass index, diabetes duration, amputation status, neuropathy symptom score, Physical Component Summary-12 quartile, Mental Component Summary-12 quartile, diabetes treatment, self-testing frequency, education, income, and race/ethnicity. Only predictors with significant findings on at least 1 element are presented.
† Adjusted odds ratios in bold had P <.05.
- Table 4.
Multiple Linear Regression Coefficients (P)* for Minutes Spent on Daily Foot Care, Exercise, Food Shopping/Preparation and Total Time Spent by Patients Spending Any Time on Each Activity
Contrast Foot Care (P)† Exercise (P) Food Shopping/Preparation (P) Total Time Spent (P) Age <45 vs >65 years −3.7 (.02) 3.9 (.26) −9.5 (.08) −6.9 (.22) 45 to 54 vs >65 years −1.3 (.33) 5.0 (.10) −7.4 (.14) 0.6 (.90) Sex: male vs female 0 (.98) 5.5 (<.01) −1.4 (.66) −5.6 (.07) Body mass index >40 vs 30 to 34 kg/m2 −2.6 (.06) −8.0 (.02) 9.3 (.09) −11.6 (.02) Amputees vs non-amputees 11.4 (<.01) 1.1 (.84) −11.7 (.14) 16.2 (.09) Foot neuropathy: no symptoms vs most −2.3 (.07) −2.6 (.34) 3.2 (.50) −4.5 (.35) Physical functioning Best vs worst quartile −3.8 (<.01) 7.1 (.02) 1.1 (.83) 0.50 (.92) Second best vs worst quartile −4.1 (<.01) 0.8 (.76) 3.0 (.50) 0.1 (.99) Third best vs worst quartile −2.8 (.02) −3.2 (.24) 4.0 (.35) 0.8 (.85) Self-testing Never vs >2 times daily −3.5 (<.01) −3.6 (.19) −5.7 (.21) −29.9 (<.01) Rarely (<daily) vs >2 times daily −2.6 (.02) −3.8 (.10) −9.1 (.01) −26.8 (<.01) Education >4 years college vs <high school −2.8 (.02) −2.7 (.27) −7.0 (.11) −6.8 (.10) Income >$75,000 vs $40 to 75,000 −3.5 (<.01) −3.0 (.21) −3.6 (.43) −5.9 (.15) Race/ethnicity White vs African Americans −4.2 (<.01) −4.3 (.05) −7.7 (.03) −15.1 (<.01) Other races vs African Americans −0.05 (.72) −5.2 (.08) 9.5 (.04) −3.1 (.52) * Coefficients in bold had P <.05.
† Each column presents results of separate linear regression models including age, sex, body mass index, diabetes duration, amputation status, neuropathy symptom score, Physical Component Summary-12 quartile, Mental Component Summary-12 quartile, diabetes treatment, self-testing frequency, education, income and race/ethnicity. Only predictors with significant findings on at least one element are presented.


