
Article Figures & Data
Figures
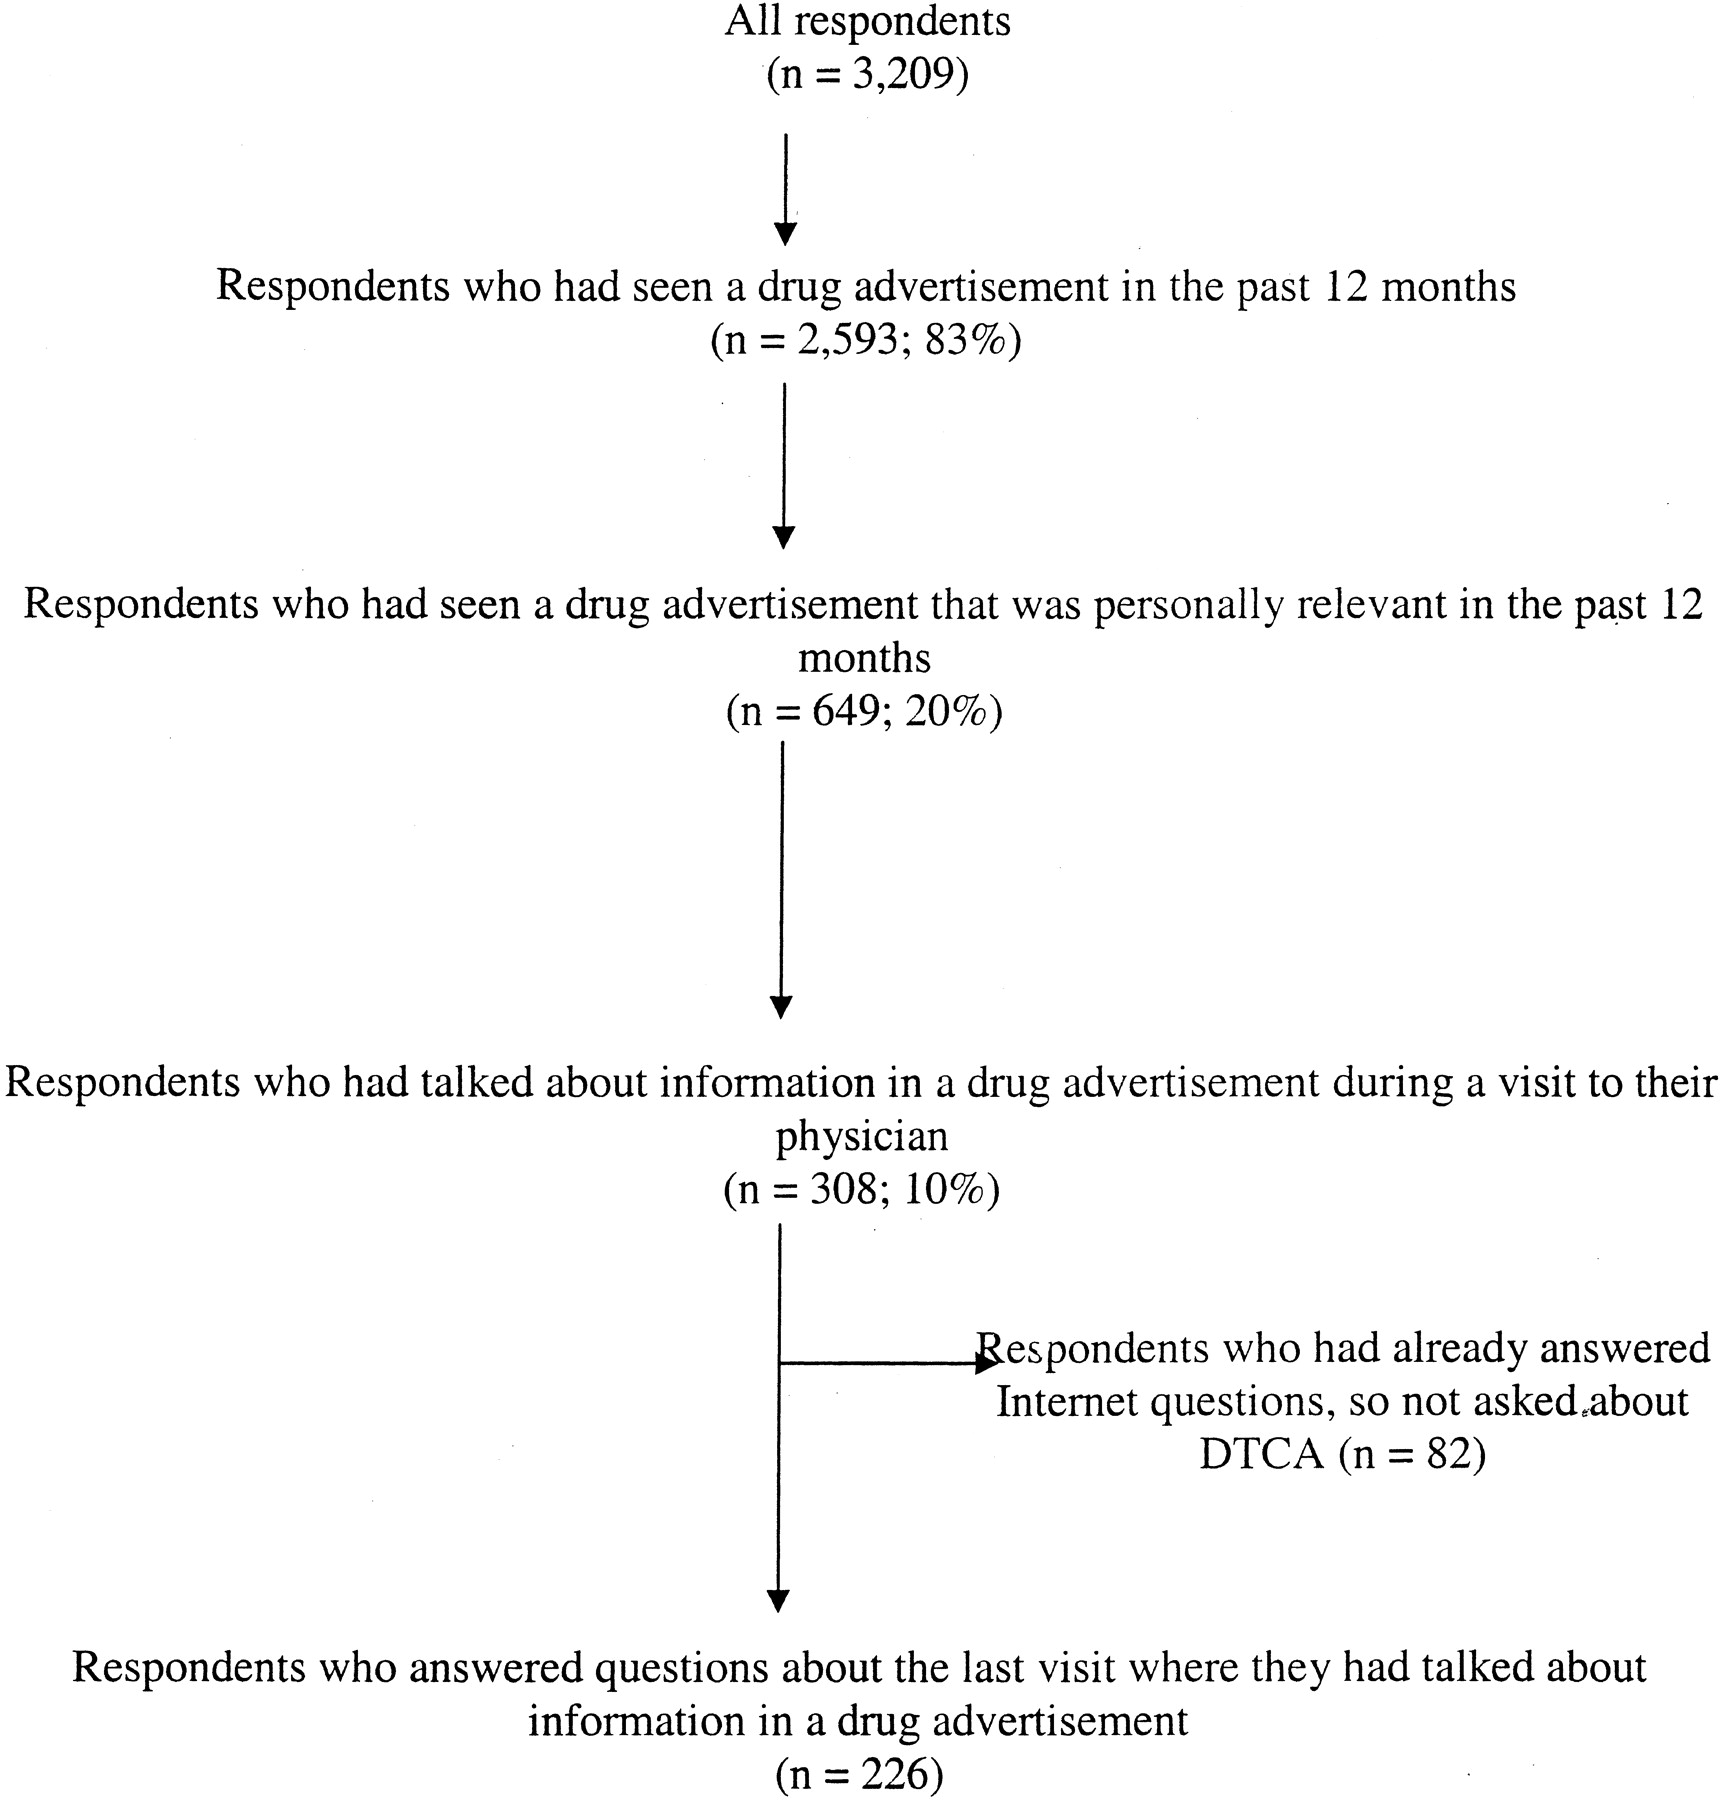
- Figure 1.
Flow chart of respondents.

Tables
- Table 1.
Summary of Hypotheses Tested, Dependent Variables Used to Test Each Hypothesis, Total Number of Respondents Experiencing Each Outcome, and Association with Socioeconomic Status
Hypothesis*: That DTCA would result in: DV N (% of Total Population)† [95% CI] Significant Associations (see text for details) Clinical benefits and harms More patients attending physicians for preventive health care. Respondent requested preventive care from a health professional Respondent attended physician or other health professional for a check-up 203 (6.3%)[5.3–7.5%] 189 (5.9%)[5.0–6.9%) Low education, Hispanic, chronic disease Low education, Hispanic, chronic disease Increased diagnoses of currently under-diagnosed conditions. Respondent diagnosed with, or told at risk of, condition mentioned in advertisement during or after consultation 28 (0.9)[0.6–1.3%] Being in managed care, no SES association Improved treatments of currently under-treated conditions. Respondent given medication mentioned in advertisement and doctor said it would benefit patient. 67 (2.1%)[1.6–2.8%] Low education, low income, not proactive about health information Worsened treatment Respondents given medication requested but doctor said it would not benefit patient 26 (0.8%)[0.5–1.2] Age 18–24 Psychosocial benefits Increased sense of confidence and control by patient during physician visit. Respondent felt more confident during visit as a result of DTCA 142 (4.4%)[3.7–5.4%] No SES association Respondent felt more in control during visit as a result of DTCA 168 (5.2%)[4.4–6.2%] Women, not proactive about health information Effect on doctor-patient relationship Enhanced disclosure of health concerns to doctor Respondent disclosed health concerns to physician as a result of DTCA 455 (14.2%)[12.8–15.8%] Low income, nonwhite, chronic disease, proactive about health information Changed global rating of relationship Respondent’s assessment of effect of discussing information from DTCA on doctor-patient relationship Improved 51 (1.6%)[1.2–2.2%] Change in relationship associated with SES. Neutral 163 (5.1)[4.3–6.0%] Worsened 11 (0.3)[0.1–1.0%] Worsened relationship associated with the request’s not being filled. Failure by patient to acknowledge doctor’s expertise or doctor experiencing difficulty with knowledgeable/activated patient Doctor acted challenged 30 (0.9%)[0.6–1.4%] Low education Serious dissatisfaction by patient Respondent sought 2nd opinion, changed doctor or health plan) 46 (1.4%)[1.0–2.2%] Low SES, no relationship with having request filled. Effects on health care system Increased costs, without commensurate health gains. Number of respondents who scheduled visit to physician to discuss ad Number of respondents who made specific requests Number of respondents who received what they asked for 55 (1.7%)[1.2–2.4%] 161 (5.0%)[4.2–5.9%] 89 (2.8%)[2.2.–3.5] Low education, being in managed care High SES * See previous article15 for full description of hypotheses.
† Outcomes are presented as a percentage of the total population of respondents to allow a comparison of the various effects on a population.
SES, socioeconomic status.
Characteristic Unweighted Weighted* % n % n Demographics Age 18–24 9 275 15.5 489 25–34 18 567 18.5 583 35–44 23 726 22 700 45–54 20 642 18 573 55–64 12 384 11 353 65+ 18 575 15 462 Gender Female 55 1757 48 1523 Male 45 1452 53 1686 Race White (non-Hispanic) 78 2477 71 2247 Black/African American (non-Hispanic) 10 319 12 390 Hispanic 8 249 11 342 Asian/Pacific Islanders (non-Hispanic) 2 58 4 116 Other (non-Hispanic) 3 82 3 90 Educational status Less than high school 4 114 5 161 Completed high school 59 1870 71 2274 Completed college 27 858 17 548 Advanced degree 11 354 7 211 Annual income <$35,000 47 1306 53 1481 $35,000–$74,999 34 962 32 904 $75,000–$124,999 13 366 11 309 >$125,000 6 176 4 120 Health status Good 62 1977 73 2333 Poor† 38 1224 27 871 Health care factors Health insurance status Insured 93 2957 85 2698 Not insured 7 236 15 474 In managed care? Yes 65 1889 66 1743 No 35 1008 34 886 % of Respondents who responded `often` or `sometimes` to the following statements: Doctors have excellent medical skills 95 2999 95 2989 Doctors are open to what patients say 83 2633 84 2648 Doctors are behind in their knowledge of research and the latest treatments. 74 2261 74 2259 Doctors spend enough time with their patients 69 2161 69 2191 Proactive approach to health information‡ Yes 40 1268 35 1134 No 60 1932 65 2068 Have a regular doctor? Yes 85 2728 81 2596 No 15 477 19 612 Rating of level of care from regular doctor, or doctor seen most often? Excellent/very good 71 2058 69 1948 Good 21 620 22 612 Fair/poor 8 225 9 246 How often does regular doctor encourage you to look for information? Often/sometimes 38 1033 38 971 Hardly ever/never 62 1667 62 1599 * Data were weighted to adjust for unequal probability of selection (including the oversample of persons in poor health). To adjust for survey nonresponse, stratification weights were developed using the March 2000 Current Population Survey from the US Census Bureau as standard. The poststratification weights were based on gender within age within race, as well as education, health insurance status (insured vs. uninsured), and household size. This weighting procedure results in a sample that is representative of the US population.
† Poor health was defined as having a chronic disease or disability that prevented respondent from participating fully in school, work, housework, or other activities; having been hospitalized other than for a normal delivery within the past 12 months; and/or the respondent defining their health as fair or poor rather than excellent, very good, or good.
‡ See text for definition.
Advertisements for prescription drugs: % Agreeing Give patients confidence to talk to their doctors about their concerns 88 Encourage people to follow treatment instructions or advice from their doctors 81 Drive up the cost of prescription drugs 76 Improve people’s understanding of medical conditions and treatments 72 Help patients get treatments they wouldn’t otherwise get 69 Promote unnecessary fear of the side effects 54 Promote unnecessary visits to doctors 48 Cause patients to take up more of their doctors’ time 38 Interfere with good relationships between doctors and patients 30 - Table 4.
Factors Associated with Seeking Preventive Care Because of Information in a Drug Advertisement
n % Yes (Mostly or Partly) P Total 2590 8 (95% CI 7–9%) Socioeconomic variables Annual Income 0.150 Less than $15,000 357 9 $15,000–$24,999 401 10 $25,000–$49,999 808 7 $50,000 or more 759 7 Education <0.001 Less than high school 242 16 Completed high school 890 8 Some college, no graduation 757 7 College graduate or higher degree 691 7 Race/Ethnicity 0.005 White, non-Hispanic 1947 7 Black/African American, non-Hispanic 287 8 Hispanic 186 15 Asian, Pacific Islander, non-Hispanic 83 7 Employment status 0.695 Not employed 183 10 Employed part-time 258 8 Employed full-time 1276 8 Self-employed 202 7 Other 661 7 Health Status <0.001 Poor health 181 5 Good health 1156 5 Chronic disease 1252 11 Insurance status 0.489 Insured through work or privately 2049 8 Medicare 117 9 Medicaid 63 10 Not insured 331 6 Managed care? 0.221 Yes 1479 9 No 708 7 Gender 0.747 Male 1210 8 Female 1381 8 Age <0.001 18–24 383 7 25–44 1052 7 45–64 775 12 65+ 352 6 Attitudes to health information Proactive about health information? <0.001 Yes 972 10 No 1615 6 Relationship with health care professionals Do you have a regular doctor or health care professional? 0.715 Yes 2139 8 No 450 8 How do you rate the overall level of health care provided by your regular doctor? <0.001 Excellent/very good/good 2127 7 Fair/poor 187 14 n % Yes (Mostly or partly) P Total 2589 18 (95% CI 16–19%) Socioeconomic variables Annual Income <0.001 Less than $15,000 356 20 $15,000–$24,999 402 25 $25,000–$49,999 809 18 $50,000 or more 759 14 Education 0.022 Less than high school 240 22 Completed high school 891 20 Some college, no graduation 757 16 College graduate or higher degree 690 15 Race/Ethnicity 0.007 White, non-Hispanic 1945 17 Black/African-American, non-Hispanic 288 24 Hispanic 186 21 Asian, Pacific Islander, non-Hispanic 83 21 Employment status 0.066 Not employed 181 12 Employed part-time 259 22 Employed full-time 1279 17 Self-employed 201 16 Other 658 19 Health Status <0.001 Poor health 182 14 Good health 1157 13 Chronic disease 1250 22 Insurance status 0.281 Insured through work or privately 2050 17 Medicare 115 24 Medicaid 64 16 Not insured 332 16 Managed care 0.226 Yes 1479 18 No 706 16 Gender 0.415 Male 1210 18 Female 1379 17 Age 0.046 18–24 383 19 25–44 1053 15 45–64 775 20 65+ 349 18 Attitudes to health information Proactive about health information? <0.001 Yes 970 22 No 1615 15 Relationship with health care professionals Do you have a regular doctor or health care professional? 0.483 Yes 2137 18 No 450 16 How do you rate the overall level of health care provided by your regular doctor? 0.003 Excellent/very good/good 2125 18 Fair/poor 187 27 n % Improved % Neutral % Worsened P Total (95% CI) 225 23 (17% to 29%) 73 (65–79%) 5 (2–13%) Socioeconomic variables Annual Income <0.001 Less than $15,000 23 22 44 35 $15,000–$24,999 42 14 86 0 $25,000–$49,999 63 22 75 3 $50,000 or more 73 21 78 1 Education <0.001 Less than high school 19 26 42 32 Completed high school 73 29 69 3 Some college, no graduation 60 15 83 2 College graduate or higher degree 71 21 78 1 Race/Ethnicity <0.001 White, non-Hispanic 169 22 77 2 Black, non-Hispanic 33 21 61 18 Hispanic 11 27 73 0 Asian, non-Hispanic 2 100 0 0 Employment status <0.001 Not employed 15 33 27 40 Employed part-time 30 10 87 3 Employed full-time 101 26 73 1 Self-employed 16 13 82 6 Other 58 24 74 2 Health Status 0.254 Poor health 16 25 75 0 Good health 55 24 76 0 Chronic disease 154 22 71 7 Insurance status <0.001 Insured through work or privately 154 21 76 3 Medicare 33 27 67 6 Medicaid 24 25 75 0 Not insured 13 15 46 39 Managed care? 0.726 Yes 143 23 73 4 No 65 25 74 2 Gender 0.011 Male 98 31 67 2 Female 127 16 7 77 Age 0.011 18–24 16 31 63 6 25–44 82 11 81 9 45–64 86 34 64 2 65+ 39 18 80 3 Attitudes to health information Proactive about health information? 0.014 Yes 104 19 80 1 No 121 26 66 8 Relationship with health care professionals Do you have a regular doctor or health care professional? 0.447 Yes 212 23 72 5 No 12 8 83 8 How do you rate the overall level of health care provided by your regular doctor? 0.001 Excellent/very good/good 200 24 75 2 Fair/poor 23 17 52 30 Did you get specific intervention requested? 0.029 Yes 89 27 73 0 No 70 20 73 7 - Table 7.
Factors Associated with Manifestations of Serious Dissatisfaction (ie, Seeking Second Opinion, Changing Doctor, or Changing Health Plan)
n % Yes P Total 225 21 (95% CI 14–29%) Socioeconomic variables Annual Income <0.001 Less than $15,000 22 55 $15,000–$24,999 43 30 $25,000–$49,999 64 14 $50,000 or more 73 11 Education <0.001 Less than high school 20 55 Completed high school 75 23 Some college, no graduation 60 13 College graduate or higher degree 71 14 Race/Ethnicity 0.031 White, non-Hispanic 170 19 Black/African-American, non-Hispanic 34 27 Hispanic 12 17 Asian, Pacific Islander, non-Hispanic 2 100 Employment status <0.001 Not employed 15 53 Employed part-time 30 27 Employed full-time 103 8 Self-employed 17 41 Other 57 26 Health Status 0.322 Poor health 16 31 Good health 54 15 Chronic disease 155 21 Insurance status <0.001 Insured through work or privately 155 14 Medicare 34 18 Medicaid 24 33 Not insured 13 85 Managed care? 0.800 Yes 143 17 No 65 15 Gender 0.231 Male 98 25 Female 128 18 Age <0.001 18–24 16 69 25–44 82 16 45–64 86 13 65+ 40 28 Attitudes to health information Proactive about health information? 0.202 Yes 103 24 No 121 17 Relationship with health care professionals Do you have a regular doctor or health care professional? 0.255 Yes 213 20 No 12 33 How do you rate the overall level of health care provided by your regular doctor? <0.001 Excellent/very good/good 200 17 Fair/poor 23 52 Did you get specific intervention requested? 0.277 Yes 89 18 No 71 26


Jump to section
Related Articles
Cited By...
- US FDA breakthrough therapy designation and consumer drug advertising: a recipe for confusion
- Direct-to-Consumer Prescription Drug Advertising and Patient-Provider Interactions
- Direct-to-Consumer Advertising in Oncology.
- Symposium: Introducing Technology into Orthopaedic Practice: How Should It Be Done?