
Abstract
Background: Early Periodic Screening, Diagnosis, and Treatment visits are designed to address physical, mental, and developmental health of children enrolled in Medicaid.
Methods: We conducted a mixed methods intervention by using a quality improvement theory. We assessed preintervention and postintervention screening rates of development, anemia, lead, oral health, vision and hearing, interventions for improvement, and barriers for the well-child visits at an academic family medicine clinic. For quantitative analysis, we assessed the preintervention baseline for 183 children and postintervention outcome for 151 children. For qualitative analysis, we used group interviews and key informant interviews to develop interventions in the preintervention stage and to explore potential barriers for further improvement in the postintervention stage.
Results: Interventions based on baseline results included user-friendly materials, checklists, posters, education, and order sets. After the intervention, there were significant statistical improvements (P < .05) for the anemia test ordered rate, serum lead test ordered rate, oral health screening and referral rates, and ordered and confirmed test rates for both vision and hearing. Despite these improvements, 3 qualitative findings indicated barriers for further improvement, including difficulties in venipuncture, medical assistant aversion to vision screening, and poor fit of equipment for hearing assessment. The procedures prompted further continuous quality improvement activities using fingerstick hemoglobin testing, a child-friendly vision screener, and manual audiometer with headphones.
Conclusions: The trial findings demonstrated potential benefits of improving screenings in an office-based intervention by using a quality improvement process. Postintervention qualitative findings illustrate additional factors that could be addressed for further improvements.
The American Academy of Pediatrics (AAP) and Bright Futures recommend preventive pediatric health care with an awareness that needs are highest among children from low socioeconomic groups.1,2 Early Periodic Screening, Diagnosis, and Treatment (EPSDT), a component of Medicaid, was implemented to improve the health of children who would otherwise be underserved. 3⇓–5 Based on AAP and Bright Futures recommendations, EPSDT seeks to address the physical, mental, and developmental health needs of children. However, Levinson6 reported that approximately 76% of children did not receive screening in one or more of the required EPSDT domains.
The US Preventive Services Task Force (USPSTF) has concluded that there is insufficient evidence to recommend for or against using routine screenings of development, anemia, lead, oral health, or hearing for children in primary care, although vision screening is recommended (Recommendation B).7⇓⇓⇓⇓⇓⇓–14 Each recommendation is illustrated in Table 1. Furthermore, AAP/Bright Futures and other studies have provided rationales for these screening items, which are also illustrated in Table 1.15⇓⇓⇓⇓–20
The US Preventive Services Task Force Recommendations and Rationales
Despite the value of these services, most practices fall short on delivering these services to the population with need. For example, several states have reported low blood lead screening rates for children enrolled in Medicaid. One of the reasons is that in developing their managed-care contracts, states decide whether to permit health care providers to refer Medicaid-enrolled children to off-site laboratories to have their blood drawn, a practice that imposes an additional burden on families and lowers screening rates.21
Previous investigators have attempted to improve the delivery of well-child screenings. Van Cleave et al. 22 reviewed 23 articles to synthesize evidence for interventions to improve such screening in primary care settings. Of the 23 articles, 5 were based on randomized controlled trials and 18 were based on observational studies. In the systematic review, screening tests, such as developmental delay, mental health conditions, vision problems, hearing problems, lead poisoning and anemia, were selected based on recommendations from AAP/Bright Futures, the USPSTF, and the Centers for Disease Control and Prevention.22
Given the compelling rationale for conducting a battery of routine well-child screenings in the primary care setting, we sought to evaluate the efficacy of baseline screening delivery in our practice, qualitatively develop an intervention and use it to measure the impact, and to conduct a postintervention qualitative assessment to identify areas potential for further improvement.
Methods
Design
We utilized a mixed methods intervention design using quality improvement theory. This involved baseline, preintervention quantitative assessments of performance on the study measures, subsequent preintervention qualitative assessments to refine the intervention, an intervention to assess the improvement of screening rates in well-child visits, a postintervention quantitative assessment of the results, and a subsequent postintervention qualitative assessment to explain the study results and to explore potential barriers for further improvement (Figure 1).23,24

Procedural diagram of the mixed methods interventional design using quality improvement theory.
For the analysis of group interviews and key informant interviews as a part of the preintervention and postintervention qualitative assessments, we used the immersion/crystallization style, which involved repeated reading of all data to reflect on the analysis until a meaningful interpretation relative to the patterns and themes emerged.25 The study was conducted at a single study site at the University of Pittsburgh Medical Center (UPMC) Shadyside Family Health Center (FHC) from September 1, 2009, to January 9, 2011. The quality improvement process was designed using the Find process, Organize team, Clarify knowledge, Understand variation, Select improvement (FOCUS)–Plan, Do, Study, Act (PDSA) theoretical model.26 The procedures of data collection and analysis are illustrated in Table 2.24,27 This study was reviewed by the UPMC Institutional Review Board and designated as “exempt” under section 45 CFR 46.101(b) (No. PRO16110549).4
Comparison of Quantitative and Qualitative Purpose, Sampling Procedures, Data Collection, and Data Management
Setting
UPMC Shadyside FHC provides health care services for underserved patients eligible for Medicaid. Pennsylvania state requires EPSDT screenings to be performed for all children in receipt of Medicaid, and the program's periodicity schedule and coding matrix requires comprehensive services to be implemented.28
Study Population
All children aged 0 to 6 years in receipt of Medicaid who attended well-child visits were eligible to participate. We excluded children at the time of chart review if they had attended for illness that mistakenly had been input as an EPSDT well-child visit. Preintervention and postintervention qualitative assessments were conducted by the FHC physicians and the office staff.
Data Collection Instruments
A list of all EPSDT well-child visits for children aged 0 to 6 years was requested from the administrative staff of UPMC Shadyside FHC. We reviewed the following 6 required screening services: development, anemia, serum lead, oral health, vision, and hearing. We categorized each age-group by using the EPSDT age ranges and constructed chart review forms by age and screening item (Table 3).29 We then collected data from electronic health records (EHRs). Inclusion criteria of each screening item was based on EPSDT, AAP, and Bright Futures guidelines.
Corresponding Distribution of Participants from Chart Reviews in Early Periodic Screening, Diagnosis, and Treatment Well-child Visits
Based on AAP/Bright Futures, EPSDT, and UPMC Shadyside FHC policy as illustrated in Table 4, we reviewed and evaluated the screenings of following screening instruments and age ranges: (1) for development screening, the number of completed Parents' Evaluation of Developmental Status forms for documentation that were performed at all age ranges; (2) for anemia screening, the number of serum hemoglobin and hematocrit measurements ordered and attempted, as well as those confirmed, at ages of 12 and 24 months; (3) for lead screening, the number of lead measurements performed or attempted as documented in laboratory results of EHRs at ages of 12 and 24 months or before the age of 6 years; (4) for oral health screening, the number of times oral health risk assessment was documented, referral to a “dental home” provider, or documentation that a child was already receiving dental care at ages of 12, 18, 24, and 30 months, and an annual referral to a dentist or documentation that the child was already receiving dental care from the age of 3 years; (5) for vision screening, the number of vision screening tests ordered, the results documented, or the documentation of an attempt by a physician or nurse, annually from the age of 3 years; and (6) for hearing screening, the number of hearing tests ordered, the results documented, or the documentation of an attempt by a physician or nurse, annually from the age of 3 years.1⇓–3
Required Screenings by Early Periodic Screening, Diagnosis, and Treatment, American Academy of Pediatrics/Bright Future, and University of Pittsburgh Medical Center Shadyside Family Health Center
Data Collection
For the preintervention quantitative assessment to establish a baseline and to design interventions, we first conducted a retrospective review of charts of 183 patients from September 1, 2009, to March 23, 2010. For the postintervention quantitative assessment to explain the outcomes and identify further barriers, we conducted a retrospective review of charts of 151 patients from September 21, 2010, to January 9, 2011 (Table 2). As a part of the preintervention and postintervention qualitative assessments, group interviews and key informant interviews were conducted. The group interview comprised 6 residents and 3 attending physicians; the group was called the longitudinal outpatient practice improvement rotation (LOPIR) group, which was a part of a progressive curriculum developed at UPMC Shadyside in 2004 to teach residents leadership skills in a specific method of clinical practice improvement.30 Key informant interviews were conducted with 2 nurses and 1 administrative manager who was responsible for data collection.31 The chart reviews were conducted manually by the 9 participating physicians of the LOPIR group based on the EPSDT age range.
Preintervention Qualitative Assessment
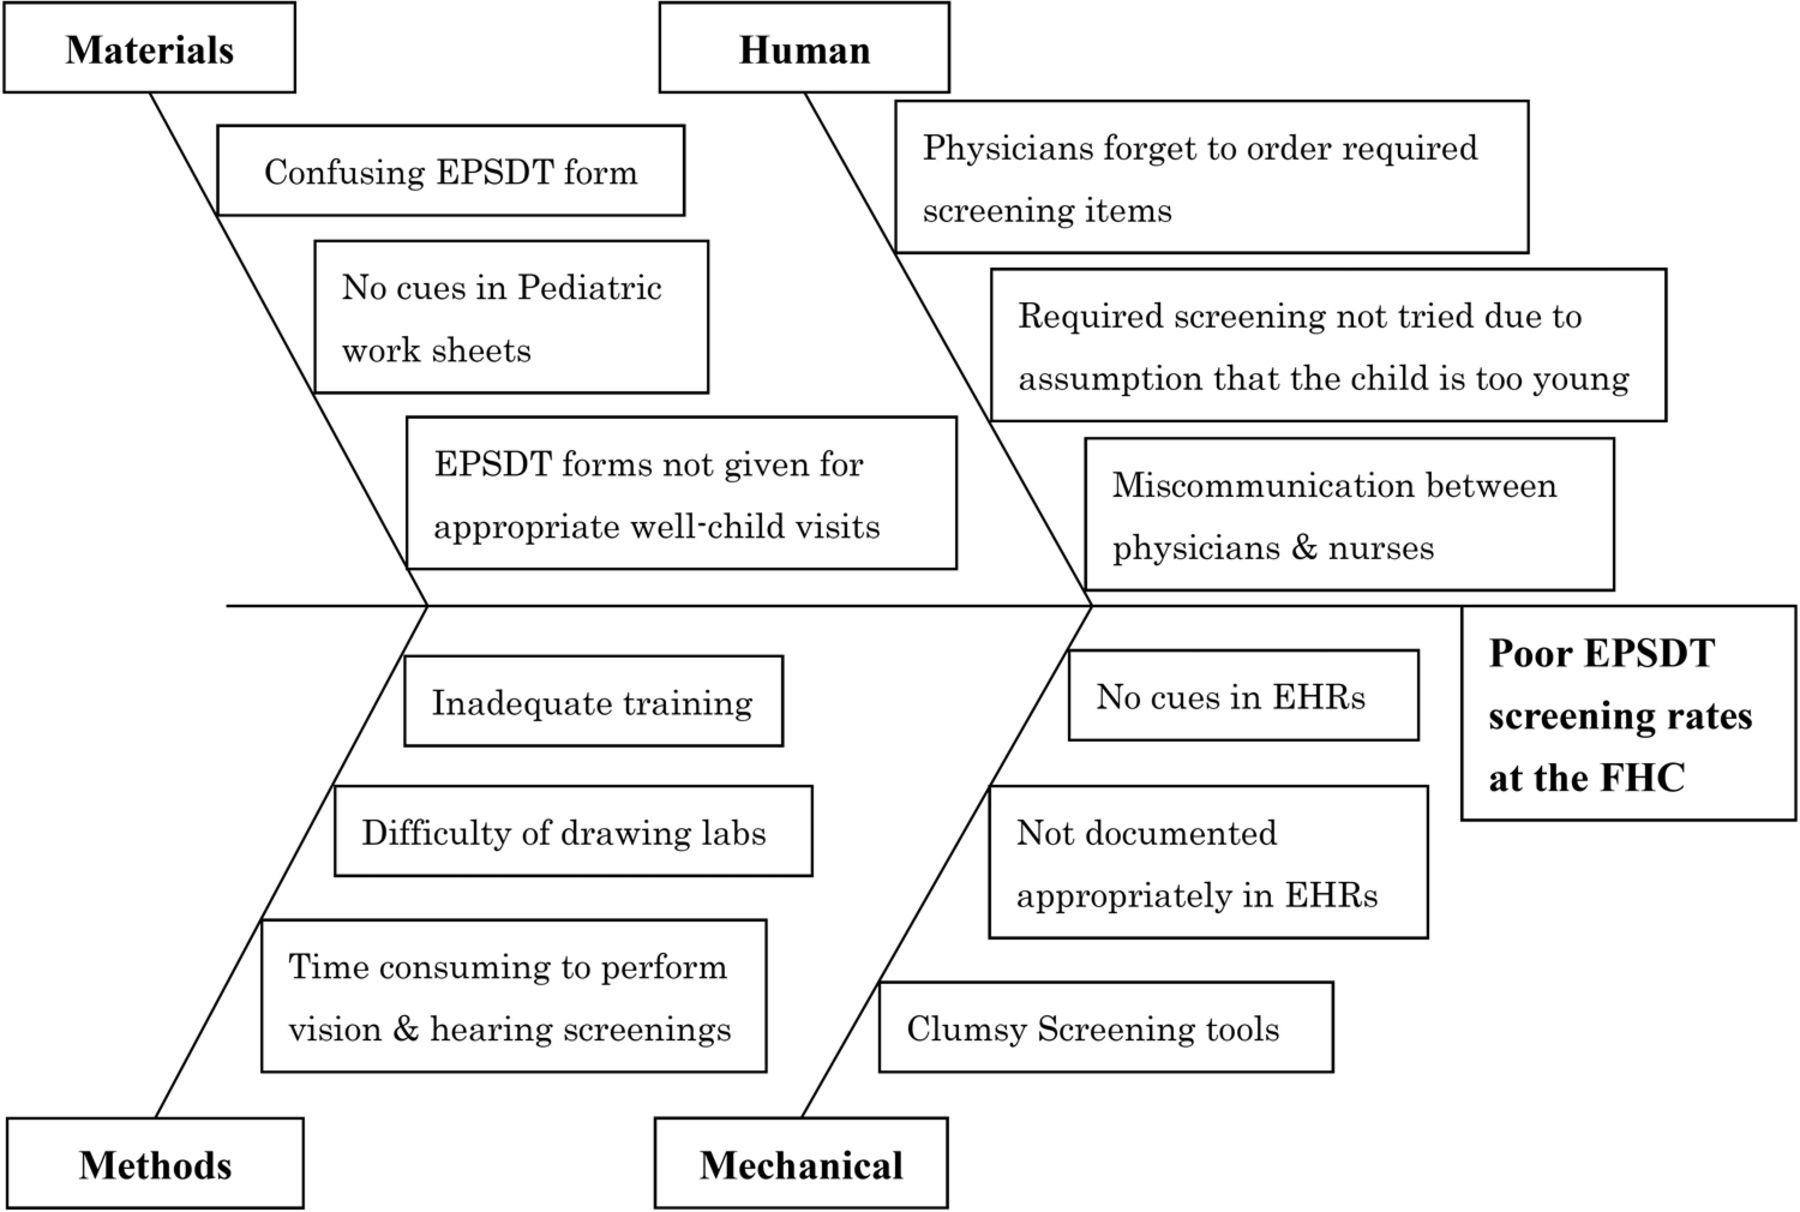
With regard to preintervention qualitative assessment, after collecting preintervention quantitative data, the following open-ended clinical questions in the interview guide were discussed in group interviews (n = 22) and key informant interviews (n = 3): “What are the barriers to compliance with current screening requirements?”, “Describe any experience when you missed ordering required screenings,” and “What difficulties do you experience during well child care visits?” These qualitative data were supplemented with field notes and observations, which were recorded by handwritten notes; these notes and observations provided context for interpreting the interview data. Some potential barriers identified in group interviews included “Physicians or nurses may not know the requirements of EPSDT screenings” and “EPSDT forms are not given appropriately for well-child visits.” We also discussed, in key informant interviews, potential barriers from the perspectives of nurses, and typical comments included, “Required screenings may not be tried due to an assumption that the child is too young to complete the test,” and “There may exist miscommunication between physicians and nurses.”
Preintervention Qualitative Data Analysis
Preintervention qualitative data were analyzed on descriptive and interpretative levels using a fishbone schema to categorize the data. Group interviews (LOPIR) were formed to create descriptive coding before the generated codes were categorized based on the relationship between codes and the underlying meaning across codes. From these sessions, we identified a framework, coded the qualitative data, used codes to aggregate related data, and categorized the verbal data for further classification and summarization in a fishbone schema (Figure 2). The data were sorted into the following 4 categories: material, method, human, and mechanical factors. Material factors included obscure physician checklists (including EPSDT forms and pediatric works sheets), method factors included inadequate training for residents and poor time management, human factors included physicians not ordering required items or the occurrence of miscommunications between physicians and nurses, and mechanical factors included clumsy screening tools or a lack of familiarity with the EHR system.

Qualitative findings from the preintervention assessment classified and summarized using in a fishbone schema. EPSDT, Early Periodic Screening, Diagnosis, and Treatment; FHC, Family Health Center.
Development and Description of the Intervention
After consideration of these potential barriers, interventional strategies to improve screening rates were determined in the LOPIR assessment meetings that were held 6 times. These findings were presented 4 times in the grand rounds and discussed with all physicians and responsible medical staff in the UPMC Shadyside FHC. Based on this process, we decided to implement the interventions summarized in Table 5.
Descriptions of Interventions to Improve Early Periodic Screening, Diagnosis, and Treatment
Statistical Analysis of the Intervention
We assessed if there was a change in delivery of the preventive services from the preintervention chart review to the postintervention chart review. We used R statistical software version 3.2.1 to calculate descriptive statistics for the preintervention and postintervention quantitative data and used the independent 2-sample Z-test of proportions, with Yates' correction for continuity (2-sided).32,33 All P values <0.05 were considered statistically significant. Power analysis was implemented to compute the ideal sample size of each group, and effect size (Cohen's h) was calculated to detect the effect retrospectively. Cohen34 reported descriptive interpretations of Cohen's h and values of 0.2, 0.5, and 0.8 were considered as low, medium and large effect size, respectively.
Postintervention Qualitative Assessment
Regarding the postintervention qualitative assessment, we discussed the following clinical questions by using an interview guide during the group interviews and key informant interviews: “What interpretations can be made from the postintervention data?”, “Describe the differences in implementing screenings between pre- and postintervention,” “What are the potential barriers to improvement?”, and “What are the ideas to improvement?” Based on a review of the results, all participants agreed that “There was an overall improvement in screening rates.” The nurses mentioned in key informant interviews that “User-friendly materials and EHRs were helpful in performing the screenings,” “Some equipment, such as audiometer, were not child-friendly,” and “Venipunctures in children were challenging.” Furthermore, some participants in the group interviews mentioned that “Some screening rates did not improve as much as expected.” Regarding improvement, there was consensus that the anemia and lead test confirmed rates still required improvement. These qualitative data were collected from field notes and observations.
Postintervention Qualitative Data Analysis
For the postintervention qualitative analysis, we used the process of immersion/crystallization involving carefully repeated reading to immerse the analysts into the data to identify factors to explain the postintervention results.25 We focused this assessment on factors that did not improve during the intervention. Each of these was discussed during the group interviews (LOPIR) and with the key informant participants. The interview data were segregated into 2 categories: lessons learned and barriers to further improvement. The lessons learned included the use of physician cues to improve screening rates, the importance of user-friendly materials and EHRs, and potentially effective implementation of interventions to multiple screenings. The barriers to improvement included difficulties in providing vision and hearing screening among younger children and difficulties in venipuncture of children.
These data were summarized using an editing approach, as the findings were topic-specific and amenable to this approach.35⇓⇓–38
Results
The breakdown of children by EPSDT age-group is summarized in Table 3, demonstrating that the age-groups were evenly distributed. These age-groups were created based on Medicaid, but not medical reasons.29 Data from these groups were used for prequantitative and postquantitative assessments. In total, 12 individuals participated in 22 group interviews and 3 key informant interviews for prequalitative and postqualitative assessments.
Effect of the Intervention
The intervention results are summarized in Table 6, where the rate of ordering or performing anemia, lead, vision and hearing tests are recorded as “Ordered” and the rate of confirmed results are recorded as “Confirmed.” For development screening and oral health screening or referral, the simple rate is given. The proportions and 95% confidence intervals (CIs) for both preintervention and postintervention are shown, together with P values. All service deliveries improved preintervention to postintervention. The preintervention-postintervention comparisons showed statistical improvements that were significant at P value <0.05 except for development screening, anemia test confirmed rate, and lead test confirmed rate. With regard to the power analysis, development screening and both ordered and confirmed rates of anemia and lead tests were calculated to be a less than ideal sample size, assuming an α level of 0.05 (2-sided) and power of 80%. Effect size (Cohen's h) revealed greater than medium effect size (h = greater than 0.50) except for development screening and lead test confirmed rates.34
Quantitative Findings Based on the Preintervention and PostIntervention Assessments using Chart Reviews
Discussion
This study aimed to assess the screening rates, interventions for improvement, and barriers to improved outcomes for well-child visits at UPMC Shadyside FHC. Our study revealed 4 major findings. First, preintervention qualitative analysis identified multiple potential barriers to improvement. During trial preparation, these were sorted and classified before the intervention. A plan to improve compliance with preintervention screening requirements was achieved using a fishbone schema (Figure 2). Second, based on the intervention, there was clinically meaningful and statistically significant improvement preintervention to postintervention in the anemia and lead test ordered rates, ordered and confirmed rates for vision and hearing assessment, and oral health screening and referral rates. Third, there were no statistically significant improvements in development screening, anemia test confirmed rate, and lead test confirmed rate; however, the lack of significant changes may be simply because of insufficient sample size. Results of the development and lead test confirmed rates were consistent with low effect size, that is, small effect. Fourth, the postintervention qualitative assessment disclosed potentially effective implementation of interventions to multiple screenings and barriers to improvement, including difficulties in providing vision and hearing screening in younger children and difficulties in venipuncture of children. These findings were leveraged for further practice improvement.
Moving forward, improvements are required in the process of venipuncture for children and more child-friendly tools should be considered for use in screening for vision and hearing problems. However, after completing the baseline mixed methods trial, the procedures prompted further continuous quality improvement activities that have been implemented to maintain the improved rates or provide a solution to these problems as LOPIR projects at UPMC Shadyside FHC.
For example, one project aimed to improve anemia screening, with changes made to pediatric worksheets (introducing a flowchart for managing abnormal results), and introduction of fingerstick hemoglobin testing for use by FHC nurses. Based on 190 chart reviews between 2011 and 2013, these interventions resulted in improved rates for test ordered and test results.39 In another intervention, to improve vision screening, the quicker and more child-friendly Spot Vision Screener was used. Based on 207 chart reviews between 2013 and 2014, this screener improved the successful completion rate for vision screening.40 Finally, an intervention using a more child-friendly manual audiometer with headphones has been implemented for screening hearing problems. Based on 172 chart reviews between 2014 and 2015, this has resulted in more marginal improvements in test ordered, test attempts, and test results among children aged 3 years.41 These subsequent studies suggest that an additional value of our mixed methods interventional trial was the development of infrastructure and physician interest in further quality improvement.
As per Van Cleave et al's22 systematic review of interventions to improve the quality of screening after an intervention, a modest improvement is typical. The current research illustrates similar findings despite the differences across and within studies of the systematic review.22 To our knowledge, no previous research has used such a systematic mixed methods intervention to collect a preintervention qualitative baseline assessment, quantitative preintervention/postintervention screening data, and a postintervention qualitative assessment. We conducted a multifaceted intervention that may be generally more effective than a single intervention. Concurrent multiple screenings and interventions may have produced a synergistic effect.
Relative to future directions, it seems there has been no systematic approach to examine which elements of a multifaceted intervention provide the greatest benefit or why similar interventions perform better in some practices than others. This highlights the need for further research to understand whether some interventions are more effective than others and why.22
On a methodologic note, integrating the qualitative preintervention assessment, the quantitative preintervention/postintervention findings, and the qualitative postintervention assessment provided a robust understanding of the overall quality improvement process. The baseline qualitative preintervention assessment helped identify problems with screening and barriers for further improvement. The qualitative postintervention assessment helped clarify why the intervention was not as effective for certain services. These findings suggest the utility of mixed methods interventional designs for other quality improvement projects in other settings.
Limitations
Our study has 6 limitations. First, it was implemented in a single facility; therefore, the results should be generalized with caution. Second, the chart reviews were conducted by multiple reviewers without assessing inter-rater reliability, which could introduce bias in favor of the effectiveness of the intervention. Third, qualitative data were not collected from patients or their proxies, and this might have precluded further ideas for interventions. Fourth, the data collection occurred under constraints of time and resources during a fixed period and precluded achievement of a sample size sufficient for detecting a difference for development and confirmed rates of anemia and lead tests. Fifth, there was a limited number of patients included per EPSDT-defined age range; relatively small sample sizes for some comparisons, for example, confirmed rates of anemia and lead tests could render those estimates less stable. Sixth, the screening rates that revealed statistical improvement may be attributed to low preinterventional screening rates; however, these results none the less suggest that multifaceted, practice-tailored interventions with ongoing outcome assessment may be effective.22
Few studies have used a mixed methods intervention theory. In this study, the integrated analysis facilitated an interpretation of the quantitative and qualitative results more robust than if they had been examined separately without integration (Figure 1).42
Conclusion
Although several barriers to further improvement were identified, our quality improvement approach resulted in enhanced screening rates. This study adds to the literature on using FOCUS-PDSA quality improvement theory to enhance the delivery of preventive services in family medicine. Previous studies have introduced a variety of interventions and outcomes to prove efficacy by using the improvements in quantitative data. As illustrated here, the qualitative data obtained by means such as group interviews and key informant interviews that were integrated with the measurements in change in services delivered provided a complementary and improved overall understanding. This reiterates the utility of mixed methods for use by clinicians, researchers, or policy makers who wish to improve the quality of patient care.22 We hope that our findings and methodology will help quality improvement-focused physicians develop a better understanding of barriers to patient care and lead to improved patient outcomes.
Acknowledgments
For their assistance with the collection of data, we acknowledge the following: Lori A Stiefel, MD; Jacqueline S Weaver-Agostoni, DO, MPH; Vincent Vargas, MD; Sawsan Jawad, MD; Josefina Paderes, MD; and Alaa Aboul Hosn, MD.
Notes
This article was externally peer reviewed.
Funding: none.
Conflict of interest: none declared.
To see this article online, please go to: http://jabfm.org/content/31/4/558.full.
- Received for publication June 5, 2017.
- Revision received December 22, 2017.
- Accepted for publication January 6, 2018.


