Abstract
The rising obesity epidemic is a phenomenon that has gained increasing attention from health providers and health policy makers. This led to recognition of nonalcoholic fatty liver disease (MASLD). The standard for its assessment has been histologic, which is neither practical nor acceptable by patients. Subsequently, a number of noninvasive assessment methods have been developed. However, despite ease of implementation, their confounding variables do hinder their accuracy. Nonetheless, the development of the liver stiffness measurement (LSM) and incorporation of other biological parameters has minimized but not eliminated the need for liver biopsy. Imaging methods are useful in evaluation, estimation, and following the progression of steatosis and fibrosis with particular attention to controlled attenuation parameter (CAP) and MRI–Proton Density Fat Fraction (MRI-PDFF). The choices for the family physician are broad and rely on tests’ availability, cost, and patient acceptance. Great efforts have been undertaken to produce more robust and novel noninvasive markers that indicate fibrinogenesis directly in an implementable and cost-effective way.
- Alanine Transaminase
- Aspartate Aminotransferase
- Biomarkers
- Biopsy
- Diabetes Mellitus
- Gastroenterology
- Liver Cirrhosis
- MASLD
- Obesity
Introduction
Nonalcoholic fatty liver disease (MASLD) is a global epidemic that was first described by the Mayo Clinic in 1980 after histologic assessment.1 Recently, the nomenclature was revisited, and metabolic-associated fatty liver disease was determined to better describe the disease of fatty liver in the presence of metabolic abnormalities and the absence of alcohol consumption.1 The global prevalence of metabolic-associated fatty liver disease in patients with type 2 diabetes mellitus (T2DM) is 55.5%, in whom 10.0% to 20.0% also have advanced fibrosis.2 It is a spectrum that ranges between fat accumulation or simple steatosis, chronic hepatitis or nonalcoholic steatohepatitis, fibrosis with progression to advanced fibrosis, and ultimately cirrhosis and subsequent portal hypertension. With disease progression and decompensation, development of end-stage liver disease eventually occurs. Up to 50% of patients develop hepatocellular carcinoma in the absence of the intermediate stage of cirrhosis. MASLD is a multisystem disease, and it has extrahepatic manifestations linked to systemic metabolic dysfunctions, such as T2DM, cardiovascular disease, and malignancy.3 Liver fibrosis is independently associated with worse liver outcomes, including decreased long-term mortality and liver transplantation.4,5
Prognosis for the MASLD patient is closely related to the stage of the disease. Furthermore, when using a diagnostic noninvasive test, the results might be nonspecific due to several confounding factors.
MASLD at a prevalence of 12.1% and low body mass index (BMI) (< 25 of non-Asian or 23 kg/m2 in Asian individuals) is called nonobese or lean MASLD6 and is characterized by visceral obesity that harbors mediators for steatosis, inflammation, and fibrosis.7 The metabolic profiles for lean MASLD show lower insulin resistance, higher fasting triglycerides, lower uric acid, and adiponectin.8,9 Patients with lean MASLD have lower median rate of survival free of liver transplantation compared with patients with nonlean MASLD (18.0 years vs 26.6 years).10 In addition, mortality is increased in patients with advanced-stage fibrosis, in the elderly, and in those who have hypertension.11 An ability to accurately assess the prognosis of all types of MASLD is needed. This facilitates for the family physician the clinical care of this wide group of patients seeking primary health care.
Multiple noninvasive assessments including blood work, radiologic images, and liver tissue stiffness measurement have been developed to accurately diagnose MASLD and its associated steatosis and fibrosis. This review focuses on the pros and cons of using noninvasive blood biomarkers, transient elastography, and radiologic methods for the assessment of steatosis and fibrosis in MASLD patients.
Noninvasive Tests
The human liver is a large organ, which poses the difficulty of obtaining accurate and appropriate sampling representation.12,13 Therefore, a uniform evaluation of the stage of liver fibrosis is needed and may possibly be achieved using blood test biomarkers. Requirements for the chosen test include easy implementation in any laboratory, good standardization, liver specificity, reflectiveness of the stage of liver fibrosis, and independence of any other nonliver related inflammation.14 MASLD assessment methods for assessment of steatosis and fibrosis can be categorized into vibration controlled enhanced tests for steatosis and fibrosis (VCTE), blood biomarkers for fibrosis, simple fibrosis scores, specific fibrosis biomarkers, and imaging techniques (Table 1).
Noninvasive Methods of Liver Steatosis and Fibrosis
Vibration Controlled Enhanced Tests for Steatosis and Fibrosis
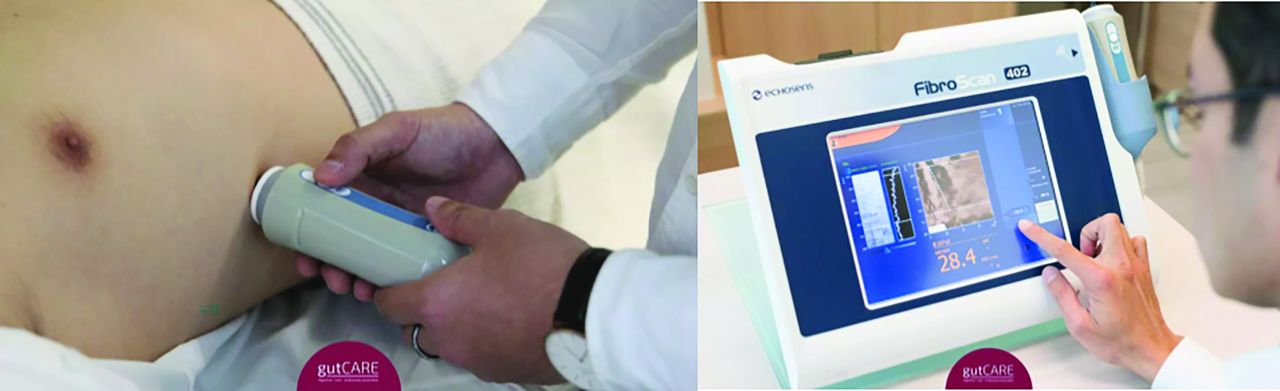
Since its approval by FDA on 2013, the transient elastography technique has been used to estimate the properties of the liver with a simple, short bedside procedure that is easily administered by a health practitioner safely and in a short time with minimal training by estimating the elastic properties of the liver stiffness. An ultrasound transducer, mounted on the axis of a vibrator probe, produces vibrations of mild amplitude and low frequency inducing an elastic shear wave propagation through the underlying tissue. It measures the speed of mechanically generated shear waves traveling at the liver parenchyma and bouncing back at the transducer to produce a reading expressed as kilopascal (kpa) for the purpose of measurement of liver stiffness and fibrosis, and similarly it measures the degree of steatosis by controlled attenuation parameter (CAP) expressed in decibels per meter (dB/m).15,16 The procedure is done over a limited area of 3cm2 of the liver using either an M or XL probe that corresponds to patient BMI chosen as a manual or automated selection by the software (Figure 1). The patient body habitus and subcutaneous and visceral fat adversely affect the reading obtained with dissipation of the propagating shear wave produced by the examining probe. It is reported that use of M probe in patients with skin capsular distance (SCD) more than 22.5 mm has an inadequate rate of measurement (OR 1.20).17 A BMI of more than 30 kg/m2, age more than 50, and a waist circumference ≥ 102 cm are associated with measurement failure and unreliable assessment.18 Moreover, median XL probe reading can significantly lower the stiffness measured compared with an M probe.19

Fibroscan procedure. (Left) Examining probe at the right hypochondrial region of the patient; (right) display monitor of transient elastography value and waveform. Courtesy of Gut Care, Singapore.
Steatosis of the liver is closely associated with the components of the metabolic syndrome, female gender, and BMI over 30 kg/m.220⇓⇓⇓–24 It is measured using an M probe and XL probe, in which each is used for a patient BMI in order to reproduce an accurate measurement. The grade of steatosis correlates with CAP measurement. In situations when the patient’s BMI is high and XL probe is used, high CAP measurement positively correlates to waist circumference and serum triglycerides level of the patient. On the contrary, low CAP measurement is negatively associated with waist circumference, serum triglycerides, serum albumin level, and alcohol consumption.25 Cutoff measurement of CAP for M and XL probes for diagnosis of steatosis are 240.5 dB/m and 239.5 dB/m, respectively.25 Chan W et al reported that using the same cutoff for M and XL probes that are steatosis grades of ≥S1, ≥S2, and S3 (248, 268, and 280 dB/m), respectively, has same characteristic sensitivity, specificity, positive predictive value (PPV), and negative predictive value (NPV).26 CAP measurement of individuals with severe degree of obesity with use of XL probe was able to differentiate between early and advanced grades of steatosis.27 Grag H et al demonstrated the ability to differentiate between moderate steatosis (S2-S3) and severe steatosis (S3) compared with early steatosis with AUROC of 0.74 and 0.82, respectively.28 CAP measurement would overestimate rather than underestimate grade of steatosis when CAP measured among the different grades of steatosis in patients with obesity versus nonobese MASLD patients.23,29
Fibrosis assessment is done using the above technique and choice of probes. Pitfalls include “unreliable examination,” which is less than 10 valid measurements, as well as “transient elastography failure” in which no valid LSM measurements are recorded. Fibroscan probes’ measurement limitations with high BMI and increased waist circumference are recognized, and a suggested score of 7 kpa has NPV of 84% for detection of fibrosis stage of ≥ F2, Furthermore, a range of 7.9–9.7 kpa allows one to rule in or rule out significant fibrosis.30 When considering the standard liver biopsy for fibrosis assessment, a good diagnostic accuracy was obtained with that score range.31 Correlation between liver biopsy and Fibroscan is discordant at a rate of 22.5% not explained by otherwise BMI, length of the biopsy specimen, or serum ALT.32 However, choice of the probe is important. XL probe use in patients with increased BMI over 28 kg/m2 is associated with OR of 1.09 discordance, higher BMI of over 40 kg/m2 would further increase discordance up to 4 to 5 times.33 Myers et al reported for M and XL probes a similar and nonsignificant accuracy of fibrosis assessment stage of ≥ F2 for significant fibrosis and cirrhosis.34 When both probes’ performance was compared, XL probe allowed for a better measurement with less failure and unreliable examinations compared with M probe. On multivariate analysis, unreliable LSM using XL probe was reported in patients with BMI ≥ 40 kg/m2 and DM, while those for M probe is skin to capsular distance ≥ 25 mm and BMI more than 35, XL probe produce lesser values than M probe with a mean of 2.3 kpa and median of 1.4 kpa.34
Methods to Improve Precision of VCTE
It is thought that combining different less invasive parameters with VCTE may improve prediction of liver fibrosis alone or by reperforming the same test. Therefore, several combinations with blood biomarkers attempted to come up with a robust score for fibrosis assessment. A 2-step method reported by Chan W et al using MASLD and FIB-4 scores followed by VCTE accurately detected advanced fibrosis; however, the cutoff score for advanced fibrosis is high (≥10 kpa).35 This combination also had decreased indeterminate scores and hence the need for liver biopsy.36 When considering combined scores of NFS and LSM of values between −2.0 and + 0.5 for NFS, LSM values between 8 and 22 kPa were associated with fibrosis stages II/III. If both criteria were met, probability of fibrosis stage II/III was 61 %. If none of the 2 criteria were met, chance for fibrosis stage II/III was only 6 % (negative predictive value 94 %).37 FIB-4 in combination with LSM was evaluated by Anstee Q et al, and significant different median values for patients with F0-F2 versus F3-F4 fibrosis were observed: (–0.972 vs 0.318 for NFS), (1.18 vs 2.20 for FIB-4), (9.22 vs 10.39 for ELF), and (8.8 vs 16.5 kPa for LS by VCTE). AUROCs ranged from 0.75 to 0.80 to discriminate advanced fibrosis. FIB-4 followed by an LS by VCTE or ELF test in those with indeterminate values (FIB-4 between 1.3 and 2.67) maintained an acceptable performance while reducing the rate of indeterminate results.38 With the use of VCTE as the sole test of assessment, repetition of the second examination on finding a first high examination resulted in a lower reading when a cutoff of 7.9 kpa for advanced fibrosis is used, and negative predictive value would be high at 91% while the positive predictive value for F3-4 increased from 45% in patients with high LSM at baseline to 61% in those with high LSM at both examinations.39 Factors associated with significant disagreement between first and second VCTE examinations are higher LSM score (OR 1.06), high fibrosis score (OR 1.22), and serum AST (OR 1.07).40
Blood Biomarkers for Liver Steatosis and Fibrosis
Simple Fibrosis Scores
BARD Score
The BARD score was developed using a simple mathematical calculation that requires BMI, serum aspartate transaminase (AST)/alanine transaminase (ALT) ratio and the presence or absence of T2DM. The score ranges from 0 to 4, in which 2 to 4 reveal advanced fibrosis.41 It was compared and validated in studies with a biopsy-proven fibrosis diagnosis and achieved a negative predictive value (NPV) of 77 to 97 and an area under the curve (AUC) of 0.67–0.77.42⇓⇓⇓–46 Risk factors for advanced fibrosis on the score derivation process include age above 50 years, AST/ALT ratio ≥ 0.8, BMI ≥ 30, DM, and platelet count less than 200.42
BAAT Score
Ratziu et al47 developed the BAAT score, in which 1 point is given for each positive finding of BMI ≥ 28 kg/m2, age ≥ 50 years, ALT ≥ 2 times the upper normal value, and a serum triglycerides ≥ 1.7 mmol/L. A total score of 0 or 1 had an NPV of 100% for fibrosis, while a high total score of 4 gave a sensitivity of 14% and a specificity of 100% for the detection of septal fibrosis.
AST to Platelet Ratio Index
The AST to Platelet Ratio Index (APRI) is a readily calculated score using available blood tests. Initially used for assessment of chronic hepatitis C infection induced fibrosis. Later, it was utilized for assessment of MASLD fibrosis. It increases with liver disease progression and is related to impaired clearance of AST by sinusoidal liver cells. A ratio of 1 has good sensitivity and specificity for the diagnosis of cirrhosis. The test’s performance in assessment of significant fibrosis varies with area under the receiver operating characteristic (AUROC) curve reported as 0.670–0.861.44,48,49
AST⁄ALT Ratio
The AST/ALT ratio (AAR) uses the available liver biochemistry panel that was first demonstrated by McPherson et al.44 It has a sensitivity of 74%, specificity of 78%, and NPV of 93% with a cutoff value of 0.8. The AUROC is 0.83. However, this measure is less robust in predicting liver steatosis and fibrosis and amenable to extra hepatic sources of serum transaminases.
Fibrosis 4 Index
The fibrosis 4 index (FIB-4) was developed by Sterling et al.50 It utilizes parameters of age, platelet count, and serum AST and ALT. With a cutoff of 1.3, A sensitivity of 85%, specificity of 65%, NPV of 95%, positive predictive value (PPV) of 80%, and AUROC of 0.8250 for diagnosis of fibrosis. Shah et al51 reported a better AUROC for FIB-4 (0.820) compared with other simple fibrosis scores (0.768, 0.742, 0.730, and 0.700 for the MASLD fibrosis score (NFS), AAR, APRI, and BARD score, respectively).
Fibrometer
The Fibrometer was developed by Cale et al52 and incorporates age, weight, fasting serum blood glucose, serum AST and ALT, serum ferritin, and platelet count. It has a sensitivity of 78.5%, specificity of 95.9%, PPV of 87.9%, and NPV of 92.1% with accuracy measure with AUROCs for significant fibrosis, severe fibrosis, and cirrhosis of 0.943, 0.937, and 0.904, respectively.52
NFS
The NFS was developed by Angulo et al53 and incorporates age, blood glucose, BMI, serum platelet count, and serum albumin. Adopting different cutoffs resulted into variable degrees of accuracy. With a lower cutoff of −1.455, NPV of 88% to 93% was obtained. A higher cutoff of 0.676 revealed a PPV of 82% to 90%. Furthermore, if serum albumin is added to the calculation, then diagnosis of significant fibrosis is reached in 13% and liver biopsy is avoided in 75% of patients, Subsequently this can correctly predict significant fibrosis, advanced fibrosis, and cirrhosis with area under the receiver operating characteristic (AUROCs) of 0.884, 0.932, and 0.902, respectively.52 In individuals with a morbid degree of obesity planned for bariatric surgery, NFS was found to predict any degree of fibrosis, significant fibrosis, and advanced fibrosis with NPV of 88%, 87%, and 98%, respectively.54
When the performance of noninvasive methods was compared with liver biopsy, FIB-4 and APRI had higher AUCs than histologic fibrosis.55 In addition, FIB-4 and NFS showed consistently better prediction of significant fibrosis.
Composite Fibrosis Markers
Enhanced Liver Fibrosis Test
The Enhanced Liver Fibrosis test (ELF) was initially developed using age, serum hyaluronic acid level, serum tissue inhibitor of metalloproteinase 3, and procollagen 3. In attempts to enhance its precision, further modification by adding BMI, status of impaired fasting glucose or DM, AAR, serum platelet count, and albumin levels and excluding age resulted in improved test performance with AUROCs for prediction of no fibrosis, moderate fibrosis, and severe fibrosis of 0.84, 0.93, and 0.98, respectively. A 1-unit increment in the simplified ELF score results into a 2-fold significant increase of liver-related morbidity and mortality on 6-year follow-up.56 ELF score precision was scrutinized by applying high and low score thresholds. Based on the prevalence of fibrosis, when a high threshold of 9.8 adopted, sensitivity was 65%, specificity was 86%, and the PPV ranged between 0.82 and 0.91. While a low threshold of 7.7 resulted in a sensitivity of 93%, specificity of 34%, the PPV ranged between 0.26 and 0.82, and the NPV ranged between 0.83 and0.99.57 ELF score ability to exclude fibrosis is influenced by the disease prevalence. The higher cutoff of 9.8 was able to correctly identify advanced fibrosis in up to 74.4% of patients and correctly excluded 92.4% of patients without fibrosis. The AUROCs for identifying significant fibrosis, advanced fibrosis, and cirrhosis are 0.81, 0.91, and 0.90, respectively.58,59 A hindrance to the wide use of ELF score is the need for a lab equipped with a Siemens Analyzer© to conduct the analysis of matrix byproducts. Nevertheless, compared with other scores, ELF is not confounded by variables such as sex, etiology of the underlying liver disease, and BMI.
FibroTest
The FibroTest (FT) is a validated score that incorporates α 2-macroglobulin, apolipoprotein A1, haptoglobin, age adjusted serum GGT, and total bilirubin. It was used for the assessment of different underlying etiologies for fibrosis of the liver and MASLD. It has a mean AUROC of 0.84 for diagnosis of advanced fibrosis. In patients with MASLD or obesity, AUROC is 0.85, and weighted AUROC for patients with DM is 0.80.60 FT is influenced by acute inflammatory states that result in increased serum haptoglobin level as well as cholestasis that elevates serum total bilirubin.
FT can be combined with other tests to generate a global assessment of the liver. FibroMAX (BioPredictive, Paris, France) in patients at risk of chronic liver disease encompasses FT (BioPredictive) for the quantitative assessment of fibrosis. SteatoTest (BioPredictive) for the quantitative assessment of steatosis and NashTest (BioPredictive) for the categorical diagnosis of MASH (see below) also incorporate FT.
Cost analysis for performance of fibrosis markers on comparison with liver biopsy favored biopsy as reported from a United Kingdom cost analysis study.61 On the other hand, using NFS and vibration controlled transient elastography (VCTE) applied by the primary care physician was the most cost-favorable while also being highly precision-effective.62
Markers of Liver Steatosis and Inflammation (MASH)
SteatoTest
The SteatoTest (ST) encompasses 10 readily available blood tests in addition to age, BMI, and sex. It has an AUROC of 0.8 and was superior to serum ALT, serum GGT, and abdominal ultrasound in identifying steatosis. However, variability may occur because BMI and serum total bilirubin can impact its accuracy. A second version was developed with an AUROC of 0.772.63 In patients with DM, the accuracy of SteatoTest was reported to be 0.76, which was higher than the classic AUROC of 0.71.60
Fatty Liver Index
The Fatty Liver Index (FLI) was developed by Bedogni et al64 to identify fatty liver. However, the index is unable to differentiate between mild, moderate, and severe steatosis. It is found to predict medical syndrome clinical outcomes, such as accelerated atherosclerosis, risk of DM, and cardiovascular risk and mortality related to hepatic, cardiovascular, and cancer related to the metabolic syndrome.64 Lipid accumulation product is calculated using waist circumference and serum triglycerides level. Similarly, Hepatic steatosis index developed in Korea uses readily available markers of serum AST, ALT, BMI, sex, and the presence of DM. It is limited by its poor ability to distinguish between mild and moderate to severe steatosis. The MASLD liver fat score utilizes several parameters similar to the former scores using serum AST, AST/ALT ratio, T2DM, serum fasting insulin, and parameters of metabolic syndrome. It was validated against magnetic spectroscopy. It can differentiate between steatosis and MASH. However, it lacks external validation.3 Its drawback is its difficulty in obtaining readily available serum insulin measurement.65
Markers of hepatic inflammation include the MASH test, which enables the identification of the presence of MASH with a reported sensitivity of 33%, specificity of 94%, NPV of 81%, and PPV of 66%. Poynard et al60 reported concordance of 33.1% between the degree of histologic MASLD activity score and the MASH test. ActiTest (BioPredictive) has a reported weighted AUROC for diagnosis of MASH of 0.84, which is significantly more than serum ALT (0.81). In addition, it performs better in patients with DM with a weighted AUROC of 0.81 and classic AUROC of 0.74.
When comparing FibroTest, SteatoTest, and ActiTest, the sensitivity analysis showed that FibroTest was highly significant in diagnosing advanced fibrosis (weighted AUROC of 0.83), and ActiTest was highly significant in diagnosing MASH (weighted AUROC of 0.84).60
Strategies to Optimize Accuracy of Noninvasive Assessment of MASLD Biomarkers
Studies have incorporated combinations of tests to validate and optimize the assessment and minimize the need for liver biopsy. Strategies used are combining a biomarker and percutaneous liver stiffness measurement (LSM) and a combination of several biomarkers. LSM is a bedside technique to measure elasticity using shear waves velocity to estimate indirectly liver fibrosis (discussed below).
Biomarker and LSM
The FAST score was developed using a combination of LSM generically known as (Fibroscan) and serum AST. It ranged between a low cutoff of 0.35 and a high cutoff of 0.67. It was externally validated and compared with FIB-4 and NFS. In a study that was composed of a pooled validation and derivation cohorts, the FAST score had good performance characteristics with negative and positive likelihood ratios of 0.2 and 5.0 for fibrosis identification that translate into an AUROC ranged between 0.74 and 0.95, an NPV that ranged between 0.73 and 1, and a PPV of 0.85.66 The FAST score limitation is attributed to its better performance at a higher fibrosis stages (more than 2 or 3). At a study conducted using a training and validation cohorts, a novel approach of a 2-step combination of NFS and LSM (with a gray zone that has an indeterminate score) reduced the need for liver biopsy to 18.8% and 19.6%, respectively, in the training and validation cohort, compared with NFS alone (30.7% and 28.3%, respectively), and for LSM (36.6% and 41.3%, respectively).36
Similarly, in Poland with patients who had an indeterminate risk score by NFS initially underwent LSM/VCTE measurement thereafter. For those with indeterminate risk scores, measurement of serum levels of caspase-cleaved keratin 18 (M30) was used to further differentiate. It showed that MASH was histologically detected in 83% of patients with NFS less than –21.455 and elevated M30 levels (> 200 U/L). Most patients (54%) with NFS less than –21.455 and M30 levels less than or equal to 200 U/L were not diagnosed with MASH. For the group of patients with indeterminate NFS (–21.455 to 0.676), 78% had increased M30 levels (> 200 U/L). MASH was detected in 95% of MASLD patients with indeterminate NFS and elevated M30 levels.67
This is particularly true when using a higher cutoff combination of FIB-4 and LSM/VCTE with an upper cutoff of 3.48 and 4.63, respectively, hence resulting in an increased number of patients requiring LSM (from 34% to 44%) and decreased number of patients who needed liver biopsies (from 33% to 19%).68 Furthermore, a combination of LSM and NFS in patients with obesity revealed a high probability (61%) of advanced fibrosis with an NPV of 94% with LSM score (8 to 22 kPa) and NFS (–2 to + 5) with agreements for fibrosis stage of 0.696 and 0.685 for LSM and NFS, respectively.37 The same authors also observed that LSM/VCTE was better than FIB-4 or NFS in terms of a high NPV and low PPV, and it performed better in nonobese patients with and without a normal serum ALT level. Furthermore, when applying a strategy of serial combination of LSM in addition to NFS or FIB-4 after an initial gray zone for NFS/FIB-4, a similar PPV and NPV was found regardless of obesity or serum ALT levels.69
For patients with DM, serial combination of NFS/FIB-4 followed by LSM compared with other scores (AAR, GGT to platelet ratio, APRI, and BARD scores) showed that using a paired combination reduced wrongly classified patients of severe fibrosis by 2.6% for NFS and 2.7% for FIB-4.70
These studies need further validation in a real-world general population where the prevalence of severe steatosis is more prevalent and severe fibrosis is less prevalent.
Repeated Biomarker Measurements
Looking at time period and liver fibrosis progression, a median of 16 years of follow-up demonstrated that an increased increment of 1 unit of FIB-4 between 2 follow-up tests was associated with an increased risk of detection of severe liver disease (hazard ratio: 1.81, sensitivity: 0.10, specificity: 0.99, NPV: 0.99, PPV: 0.13, accuracy: 0.98). Faster progression with age above 65 years showed a mean annual change of 0.032 for males and 0.018 for females.71 Another study followed up patients for 17.1 years and determined the baseline level of fibrosis by biopsy. During follow-up, patients underwent several noninvasive assessments including FIB-4, NFS, APRI, and dynamic AAR. No significant correlation for the studied markers and only weak association for dynamic AAR was found in patients with advanced fibrosis at baseline. However, for the group of patients with mild fibrosis at baseline, there was a significant association for FIB-4, APRI, and dynamic AAR but not NFS according to the univariate and multivariate regression analyses.72
Anstee et al.38 analyzed a cohort of 3202 patients with biopsy-confirmed fibrosis (F0-F2: n = 940; F3-F4: n = 2262) and demonstrated that patients with indeterminate scores on FIB-4 followed by LSM/VCTE or ELF maintained an acceptable accuracy and reduced the rate of detecting indeterminate scores. Another study was of a diabetic population of 2770 patients with an FLI score > 60 stratified into risk groups. FIB-4 and age-adjusted FIB-4 were used in the group of patients with an indeterminate degree of fibrosis who were referred for liver biopsy. Age-adjusted FIB-4 decreased the rate of biopsy referral to 13.4% compared with 28.3% when standard FIB-4 was used.73
Prognostic Accuracy of Liver Fibrosis Scores
Recently, a systematic review by Lee et al74 showed that the AUROC for diagnosis of fibrosis and subsequent liver-related events for FIB-4, NFS, and APRI were 0.71–0.89, 0.72–0.92, and 0.69–0.89, respectively. In addition, the predictive accuracy of progression to advanced fibrosis for FIB-4, NFS, and APRI was 0.65–0.81, 0.65–0.83, and 0.65–0.72, respectively. The length of follow-up did not impact the performance of any marker.
Confounding Factors That Affect Noninvasive Tests for MASLD
Genetic Factors
MASLD has a genetic basis that works along with the environmental influences to establish the disease phenotype. Genetic alleles vary among ethnic groups. Mutations in patatin-line phospholipase domain-containing protein 3 (PNPLA3) have been frequently reported in patients with MASLD. The BARD, FLI, and Hepatic Steatosis Index scores were found to have good performance for the CG and GG alleles of PNPLA3. The FIB-4 score performed poorly in patients with the CC allele. Its application is limited in clinical practice by the presence of less polymorphisms affecting MASLD progression (TM6SF2, MBOAT7, and GCKR), the difficulty of applying a cutoff for inflammatory biomarkers along with determining polymorphisms, and the presence of other genetic polymorphisms.75,76
Ethnicity
Asian individuals, especially South Asian populations, possess a high dysmetabolic state with a lower BMI, which affects the accuracy of several simple fibrosis scores like AAR, NFS, FIB-4, APRI, and BARD scores.77 Conversely, Fu et al78 demonstrated that ethnicity (patients from China and Malaysia compared with Caucasians) had no influence on MASLD and liver fibrosis. Hence, the effect of ethnicity cannot be completely attributed to the country of origin. Several other factors may come into play, like environmental factors (diet, daily activity) of the particular ethnic group and the underlying genetic background.
Age
Interpretation of fibrosis scores relies on accuracy of the assessment in which age could be a factor. Increased age is associated with advanced fibrosis stage and cirrhosis. Elderly MASLD patients had a higher fibrosis score according to APRI, NFS, and FIB-4 compared with nonelderly patients with MASLD.79 The performance of simple fibrosis scores is affected by age over 65 years. Loss of specificity for the FIB-4 score was observed, which increased false positive rates.80 Interestingly, there were no differences in AUROCs when comparing simple fibrosis scores between elderly and nonelderly patients with MASLD.79 Moreover, 54% of patients with an indeterminate NFS score were not reclassified when the cutoff was determined by age.81
Increasing age is significantly associated with factors such as female sex, hypertension, the presence of T2DM and MASH, AAR, NFS, and FIB-4 for the diagnosis of advanced fibrosis.82 AAR, NFS, and FIB-4 poorly predicted fibrosis stages 3 and 4 in patients with advanced fibrosis who were younger than 35 years of age. In addition, specificity was lowered in the elderly (above 65 years), with a high false positive rate. A negative association between serum ALT levels and patients with no to mild fibrosis and patients with moderate to severe fibrosis was observed when determining the AAR.83
The cutoff was adjusted to improve their performance to NFS > 0.12 and FIB-4 > 2.0, which reduced the false positive rate to 50% and 35%, respectively. Bayrak et al84 demonstrated in a cohort of patients with dyspepsia who had MASLD vs those without MASLD that the Homeostatic Model Assessment for Insulin Resistance score was the most sensitive (85%) while the Nippon score was the most specific (92%) for the assessment of advanced liver fibrosis.
Weight
In cases of liver fibrosis but not steatosis, fibrosis assessment scores are affected by weight and BMI. Weight loss has been shown to improve the stage of liver fibrosis by 10%. However, this was achieved in only 10% to 12% of the studied patients.85 Obesity and morbid obesity led to overestimation of advanced liver fibrosis (stage F3–F4) when NFS is used.86 This limitation can be resolved by combining noninvasive tests with LSM (such as Fibroscan) or by serial combination of LSM with FIB-4 or NFS among patients who had an indeterminate score.69
Serum Transaminases
Despite the relevance of serum AST and ALT in assessment of hepatocellular function, when used in isolation, their utility in fibrosis assessment is obsolete. At a higher stages of fibrosis AAR (The AST/ALT ratio) performed poorly for the assessment of advanced liver fibrosis in the younger population (< 35 years old).82 Furthermore, AAR is not able to differentiate between mild and moderate fibrosis.87
Biochemical Panel
Serum albumin affects calculation and interpretation of NFS. Albumin levels can fluctuate in conditions such as nephrotic syndrome, protein losing enteropathy, and chronic illnesses. Blood hemolysis, biliary diseases, and Gilbert’s disease affect total bilirubin and haptoglobin, which are used in the SteatoTest. Serum ferritin is an acute phase reactant that may change during the course of liver disease and can affect Study of Health in Pomerania (SHIP) score.
Blood Cells
It is known that with a progressive chronic liver disease and subsequent development of liver fibrosis and portal hypertension will mark a state of hypersplenism. Platelet count below 150 correlates with portal hypertension.
Components of the complete blood count that are white blood cells (WBC) and platelets count (Plt) used within scores that predicts liver fibrosis. These are APRI (using serum AST and platelets count), FIB-4 (using serum ALT, platelets count and age of the patient in years), and NFS (using age of the patient in years, Body mass index, serum ALT and AST, hyperglycemia, and serum albumin).
The MASLD ridge score (a marker of liver steatosis) includes white blood cell levels for calculation encompass serum ALT, HDL-cholesterol, triglycerides, hemoglobin A1c, white blood cell count, and hypertension. It has a sensitivity of 92% and specificity of 90% as well AUROC 0.87. However, variability of white blood cells level due to concurrent infection or bone marrow disorders affect its precision.88
Indeterminate Score of Fibrosis
Indeterminate fibrosis scores denote measurement that does not correspond to the positive or negative diagnosis of liver fibrosis in the test used in measurement, which does not favor the diagnosis of interest. It is often reported in simple fibrosis markers and LSM/VCTE. In this case, the score does not fit within the low or high risk of inflammation or fibrosis. Approximately 30% of patients fall in this indeterminate range. The presence or absence of fibrosis can be confirmed by liver biopsy but it is not a precise sample and hence not useful for accurate diagnosis. In a cohort of patients with mild fibrosis (F0-F2) and severe fibrosis (F3-F4) with similar serum AST, ALT, AAR, albumin, and GGT and an indeterminate score, 45% showed no evidence of fibrosis.89 However, careful interpretation of these data are needed because the quality and number of biopsies were not identified.
Attempts have been made to rectify the performance of biomarkers to overcome indeterminate scoring. Since early development of NFS by Angulo et al53 it increased fibrosis identification and avoided liver biopsy in 76% of the whole cohort. In addition, it decreased the need for biopsy in 24% of patients with an indeterminate score. Adding serum levels of M30 in patients with an indeterminate score from NFS led to minimized need for liver biopsy performance in patients with MASH and fibrosis.67 Attempts have been made to reduce the rate of indeterminate scores to 5% by readjusting cutoffs of combined NFS or FIB-4 with LSM with sensitivity ≤ 80% and specificity > 80%.68
Liver Biopsy
Liver biopsy for every patient with suspected MASLD is controversial and impractical. Biopsy studies have shown the presence of all ranges of necro-inflammatory activity and fibrosis, including cirrhosis, in adults with a normal ALT level.90 By definition, MASLD can be diagnosed if at least 5% of the liver has signs of steatosis, and there are requirements for the location of the biopsy. Histologically detectable inflammation within steatohepatitis is predominantly comprised of “chronic” inflammatory cells (lymphocytes, plasma cells, monocytes, and macrophages). Steatosis may be a mixed small and large droplets as well as fat globules may actually form fat cysts that may rupture into the sinusoids. Serologic testing for keratin 18 fragments (K-18), which is a marker of apoptosis, has shown a sensitivity and specificity for MASH of 77% and 92%, respectively. Megamitochondria in round or crystalized forms may be present. In adults with MASH, the initial site of fibrosis is within zone 3. Early collagen fiber deposition is noted in a pericellular, perisinusoidal, and “chicken wire” distribution in acinar zone 3.91
Factors that improve the diagnostic accuracy of liver biopsy include quantitative techniques, the presence of uniform disease throughout the liver, multiple passes of a Tru-Cut needle (15 gauge), and biopsy of 2 cm or greater in length14. Increasing the length of liver biopsy decreased sampling error. Although a 25 mm length biopsy is considered optimal for an accurate evaluation of noncirrhotic fibrosis stages, a 15 mm biopsy with adequate number of portal tracts is considered sufficient for evaluation. A 16-gauge needle with an inner diameter of 1.2 mm, which is larger than a liver lobule (0.5-1.0 mm), is considered adequate.92 A thick needle is superior to a fine needle for assessing the presence of advanced fibrosis and cirrhosis.93 The subcapsular area of the liver tissue is generally more fibrotic, and the left lobe is characterized with larger portal areas near the capsule than the right. Thus, it is important that both pre= and poststudy biopsies are done in a similar fashion and from the same region of the liver.94
Four current methods of semiquantitative systems of evaluation for histologic lesions of MASLD may be used. They are the “Brunt” system, the MASH CRN Pathology Committee system for MASLD Activity Score (NAS), the fibrosis score, and the Fatty Liver Inhibition of Progression algorithm.95 NAS is a widely used histologic classification for MASLD/MASH that is recommended for definition and quantification of disease activity in clinical trials.96 NAS ranges from 0 to 8 and is derived from the sum of steatosis (0 to 3 score), ballooning (0 to 2 score), and lobular inflammation (0 to 3 score). However, 2 of these factors have been shown to have high variability between pathologists.
In attempting to improve the accuracy of diagnosing MASH by liver biopsy, the best diagnostic value was achieved when the diagnosis of steatohepatitis relied on the presence of hepatocyte ballooning within the context of steatosis, with an AUROC of 0.81 (95% confidence interval [CI]: 0.65–0.9) if the prevalence was 63% for other findings have been modest at best and include bridging fibrosis (with Brunt scores 3 and 4), perisinusoidal fibrosis, and extensive perisinusoidal fibrosis with AUROCs of 0.87 (95%CI: 0.70–0.95), 0.82 (95%CI: 0.67–0.91), and 0.79 (95%CI: 0.55–0.91), respectively. The best reported sensitivities for double biopsies were lobular inflammation (88%) and perisinusoidal fibrosis (76%). Furthermore, when a study performs 2 or 3 liver biopsies, cirrhosis was diagnosed in 80% of cases from the first biopsy and in 100% of cases using the 3 biopsies.97
Liver biopsy has been considered a relatively a “minimal” intervention, but it is an invasive procedure with complications including pain and minor and major bleeding (0.3%). Organ perforation is uncommon but may occur during the blind biopsy method. Death, albeit rare, has been reported in 0.01% of patients. A 25% false negative or positive rate has been reported when classifying broad overlapping fibrosis stages. It is exacerbated in cases of intermediate (mild-moderate) fibrosis. Liver biopsy has a U-shaped accuracy for intermediate stages due to observer agreement variability in distinguishing stage F1 from F2 because the stages are so similar.92
Another clinical dilemma is the growing population of lean MASLD and its unique histologic manifestations. In a meta-analysis by Sookoian et al,98 the observed difference in means between the MASLD and lean MASLD was 0.28 ± 0.13, which represented an increment of approximately 24.82% (over a pooled mean fibrosis score of 1.128 in the lean group). Meta-regression analysis showed no significant correlation between differences in age, Homeostatic Model Assessment for Insulin Resistance, or waist circumference and liver fibrosis.98 The risk of having MASH (odds ratio: 0.58, 95%CI: 0.34–0.97) was significantly lower in patients with lean MASLD compared with patients with overweight/individuals with obesity MASLD. Patients with lean MASLD had a significantly lower mean NAS compared with patients with overweight/individuals with obesity MASLD, but neither age nor waist circumference could explain the observed difference in the NAS.
Novel Noninvasive Markers of MASLD
Several new blood biomarkers are becoming recognized as markers of MASLD. They were discovered after identification of the pathways involved in MASLD and proved to be a useful biomarkers.99 A recent systemic review highlighted the potential role of α-ketoglutarate and CK18-F as the best potential biomarkers of MASLD.100
Inflammatory Markers
Inflammatory markers include Golgi protein 73 that is expressed in the epithelia of the bile duct and correlates to the severity of the MASLD. Interleukin-6 and vascular cell adhesion molecule one can differentiate the degree of severity of MASH, with AUCs of 0.83 and 0.87, respectively. Interleukin-8 levels are increased in patients with obesity and may be a potential diagnostic biomarker. Signaling lymphocytic activation molecule family 1 levels were significantly increased in MASH plasma samples compared with their respective controls.101
Apoptosis Markers
M30 and M65 have reported sensitivities of 70.0% and 63.6%, specificities of 83.7% and 89.4%, and AUCs of 0.71 and 0.81, respectively. These may serve as a promising candidate biomarker.
Hepatokines and Adipokines
Considering the association of adipocytes and lipid accumulation in MASLD, several proteins may be potential biomarkers. They include adiponectin, visfatin, resistin, adipocyte fatty acid-binding protein, angiopoietin-like protein-1, -2, -3, -4, -6, and -8, fetuin-A and -B, FGF-1, -2, -19, and -21, heparin, and retinol-binding protein. FGF-21 was increased in patients with obesity and adolescents and independently correlated with MASLD.
Omics
Omics can be defined as the group of molecules related to the underlying genomic characteristics and its underlying postprocessing. It includes several areas of interest: genomics, epigenomics, transcriptomics, proteomics, metabonomics, and lipidomics.
Genomics
The patatin-line phospholipase domain-containing protein 3 rs738409 and TM6SF2 rs58542926 are known genes with single nucleotide polymorphisms shown to be related to development of MASLD. Other gene polymorphisms have been reported to be related to MASH, including DYSF, MBOAT7, LYPLAL1, PPP1R3B, HSD17B13, PYGO1, and GATAD2A.
Epigenomics
The methylation levels of peroxisome proliferator-activated receptor γ in plasma-free DNA may differentiate severity levels of MASLD. An altered methylation status for genes such as SLC7A11, ACSL4, and CPT1C in serum of patients with MASH has been observed.
Transcriptomics
Several RNA sub molecules were identified in relation to MASH and fibrosis. MicroRNA (miR)-122 and miR-34a play major roles in the post transcription translation process. Long noncoding RNA regulates gene expression through chromatin modification, activation/repression of transcriptional enhancers, and targeting miRNAs (competing endogenous RNA). Circular RNA (circRNA) competes with miRNAs to bind target genes and regulate downstream gene expression. Overexpression of circRNA_002581 significantly attenuated the inhibitory effect of miR-122 on CPEB1, which is involved in the pathogenesis of MASH through the CPEB1-PTEN-AMPK-mTOR signaling pathway. Deficiency of circRNA_0046366 and circRNA_0046367 has been shown as a characteristic of MASLD. Silencing of circ_0071410 was shown to alleviate hepatic stellate activation, a key step in liver cirrhosis.102
Proteomics
Elevated hemoglobin levels is associated with development of MASLD. A2M and coagulation factor V were highly correlated with MASH-related fibrosis.
Metabonomics and Lipidomics
Serum pyroglutamic acid is able to differentiate between patients with MASH and patients with steatosis with a sensitivity of 72%, specificity of 85%, and AUC of 0.82. Other biomarkers associated with MASLD include fatty acids, 5-HETE, 8-HETE, 15-HETE, glycyrrhetinic acid, and taurocholate.
Extracellular Vesicles
Extracellular vesicles are released from the cell and are involved in signaling and transduction. They include microvesicles, exosomes, and apoptotic vesicles. Exosomes can interact with stellate cells and macrophages. Exosomal miR-122 seems to be elevated in MASH. Other exosomes reported in liver biology are CD4, CD8, CD14, CD15, TER119, CD41, CD62P, miR-122, and miR-192.
Miscellaneous Biomarkers
Thymosin β 4 is a G-actin sequestering peptide with several roles in critical biological processes. A cutoff value of ≤ 900 ng/mL had 100% sensitivity, 100% specificity, 100% positive predictive value, and 100% negative predictive value for the prediction of MASLD.103 Mitochondrial dysfunction has a central role in the pathogenesis of MASLD, which may increase the risk of developing steatosis and hepatocellular inflammation. High MASH activity and fibrosis were independently associated with a significant decrease in cumulative (13)C-exhalation, expressed as cPDR (%) when the C13-methionine breath test was used. The reported AUROC for MASH diagnosis was estimated to be 0.87 in the total cohort and 0.83 in patients with no or mild fibrosis (F0–F1).104
Serum uric acid has been implicated in metabolic syndrome and insulin resistance. However, there is lack of studies to suggest its use as a biomarker in MASLD.105 Biglycan is a small leucine-rich proteoglycan that has a role in several fibrotic processes in the lung, liver and kidney. Biglycan was an independent predictive factor of significant fibrosis (odds ratio: 1.030, 95%CI: 1.011–1.048, P < .001). ROC analysis revealed a statistically significant role in the determination of fibrosis (AUROC: 0.955, 95%CI: 0.877–0.990, P < .001). The best cutoff value was 189.58 pg/mL with a sensitivity of 93.55% and a specificity of 87.18%.106 Extracellular matrix components type IV collagen 7 Seconds may be a serum marker of fibrosis in patients with MASLD and T2DM. It forms a loose “network” around the sinusoids and was shown to remodel the fibrosis process. It had a high AUROC compared with the FIB-4 score, NFS, and APRI.107,108
Imaging Techniques for Assessment of Steatosis and Fibrosis
Imaging is an accessible method for the family physicians to evaluate the liver status of their patients and is relatively cost-effective, affordable, and reputable. The imaging methods used are abdominal ultrasound (US) and magnetic resonance imaging (MRI) with no radiation hazard and computerized tomography (CT) of the abdomen. The ability to monitor disease progression and regression in response to treatment is an advantage.
US of the Abdomen
US is an accessible method for the family physician and often ordered for nonliver related patients’ complaints with a note of liver increased echogenicity diagnosing fatty liver disease for the first time. Steatosis generally is demonstrated with increased parenchymal echogenicity in comparison to the kidney parenchymal density.109 US is able to provide quantitative and qualitative assessment of MASLD. It is operator dependent and requires breath-holding of the examined patient. Earlier studies showed no correlation to grade of steatosis of liver biopsy but not the stage.110 Its performance characteristic and diagnostic accuracy is better in patients with moderate to severe steatosis with a sensitivity and specificity of (80 to 91%) and (87 to 98%), respectively, compared with mild steatosis with sensitivity and specificity of (55.3 to 66.6%) and (77 to 93.1%), respectively.109,111 To overcome the limitations related to the procedure, Several modifications and indices were developed to optimize its usefulness. Quantitative US is found to rely on backscatter, waves attenuation, and speed of sound difference.112 Techniques used in US are Shear Wave Elastography (SEW), Attenuation Imaging Coefficient (AC), Hepatic Steatosis Index (HIS), Portal Vein Pulsatility Index (PVI), US Index, and Controlled Attenuation Parameter(CAP).
Shear Wave Elastography (SWE) is a technique that is used for inflammation and steatosis that allows differentiation between low and high-risk MASH. The underlying liver inflammation is less affected using this technique compared with transient Elastography using M and XL probes, likewise SWE is less affected by steatosis than transient elastography using M probe only.113 On multivariate analysis comparing the diagnostic accuracy between SWE, TE-M probe and TE-XL probe most improvement in diagnosis of the inflammation with AUROC of 0.816, 0.824 and 0.824 respectively. SWE has a higher performance for advanced degrees of fibrosis (F3, F4) with AUROC 0.780 versus TE- M probe 0.764.113 For MASH assessment especially diagnosis of high risk MASH, SWE has an accuracy, sensitivity and specificity of 0.73,77% and 66% when using a cutoff 8.4 kpa.114
Attenuation Imaging Coefficient (AC) is compared with liver biopsy and found to be positively correlated (r = 0.58) especially with higher degrees of steatosis with AUROC, sensitivity and specificity of 0.892,96% and 74% when AC is more than 0.72 cutoff, furthermore the presence of advanced liver fibrosis does not affect the calculated AC.115 AC is moderately correlated to MRI-Proton density fat fraction (MRI-PDFF) with AUROC that showed that higher fat fraction of ≥ 10% is accurately diagnosed (0.88) compared with ≥ 5% with accuracy of 0.76.116 Hepatic steatosis Index (HIS) demonstrated an accuracy of AUROC of 0.833 with a high sensitivity and PPV of 88.7% and 92.1% but low Specificity and NPV of 63.4% and 53.6%.117 Portal Vein Pulsatility Index (PVI) demonstrated significant association between MASLD risk category, degree of steatosis and PVI.118 US Index, an integrated index that incorporates SWE, hepatic renal index (HRI), and serum AST, has a better diagnostic performance for fibrosis and steatosis compared with transient elastography (TE). This is more robust with advanced degrees of fibrosis and steatosis. Using the integrated US Index above at a cutoff 0.4213 has accuracy, sensitivity and specificity of 0.806,68% and 80% compared with TE accuracy of 0.687.119 Finally, controlled attenuation parameter (CAP) is a technique that uses ultrasound data on continuous display, it is proved highly accurate with accuracy of (0.889–0.900) when compared with MRI-PDFF as a reference standard.120
CT Scan of the Abdomen
CT scan of the abdomen has the capability to evaluate visceral and subcutaneous fat using contrast studies by portal venous images providing better studies than unenhanced images. Moderate to severe steatosis at an attenuation threshold 48 Hansfield units (HU) is diagnosed with a high specificity and PPV of 100% and 100%, and low sensitivity of 53.8% with NPV of 93.9% in a biopsy proved cohort.121 A cutoff of –9 has a sensitivity and specificity of 82% and 100%, respectively.109 When using a developed score of Mean CT Liver–spleen index (CT L-S) it is found to be strongly correlated to biopsy findings of steatosis expressed in liver triglycerides and hepatic macrosteatosis (HMS) (r = –0.79) and (r = –0.88), respectively, and would eliminate potential errors.122 By visually comparing hepatic and vessels attenuations on unenhanced CT scan in a visual grading system (VGS), the higher the steatosis grade (≥30%) the better the accuracy and agreement between readers with the yield of sensitivity of 80% and specificity of 90% and AUROC of 0.9.123 Lower stages of steatosis and fibrosis are less accurately diagnosed. To overcome that, placing a standardized phantom under the patient’s back would further improve sensitivity, specificity, PPV and NPV to 76%, 85%, 78%, and 83%, respectively, in mild degrees of steatosis.111 When incorporating a score that combined CTL-S, BMI, serum TG, and serum ALT, a Clinical CT index showed a diagnostic performance with accuracy of AUROC 0.82 better than CTL-S (0.74); however, specificity is modest to low with the cutoff ≥ 46 that is 40.7 to 44% and sensitivity is 90%.124 With the high radiation exposure, these limitations render CT scan not feasible for monitoring of MASLD regression or progression.
MRI of the Liver
MRI of the liver involves different techniques that allow assessment. It is able to offer whole body fat and liver parenchymal quantitative and qualitative evaluation125 with ability to provide evaluation even in individuals with severe stage obesity.126 MRI techniques studies outcomes alone and in combination with blood markers were evaluated in steatosis and fibrosis. MRI techniques use for our purpose of evaluation are Multiparametric, Liver surface Nodularity, MRE (MR elastography), MR spectroscopy, 2-Point echo Dixon method, and MRI-PDFF (with evaluation of fat fraction).
Multiparametric MRI is used for evaluation of steatosis and fibrosis assessment. The multiple parameters include T1, T2 mappings, and proton spectroscopy. Corrected T1 mapping significantly correlated with biopsy proved significant liver fibrosis but not mild to moderate with a threshold of 800 Ms. It has a sensitivity, specificity, and AUROC of 86%, 93%, and 0.94, respectively, while its ability for evaluation of steatosis has accuracy with AUROC 0.90.127 Kim JW et al128 reported a Multiparametric MR Index that combined fat fraction, liver stiffness, and T1 relaxation times using a cutoff of 4.6 with a reported sensitivity, specificity, and AUROC of 95,77.8 and 0.833 for staging steatosis. Liver surface nodularity is evaluated using a derived score that is able to detect significant fibrosis at a threshold of 2.23 and accuracy of AUROC 0.80 and advanced fibrosis at a threshold of 2.44 and AUROC of 0.86.129 MRE (MR elastography) and its elastography capability to detect fibrosis were shown to have an accuracy of AUROC of 0.957 as compared with a number of blood prediction parameters (AST:ALT ratio, APRI, BARD, FIB-4, MASLD Fibrosis Score, Bonacini cirrhosis discriminant score, Lok Index, and MASH CRN model) in whom their accuracy ranged between 0.796 to 0.861; FIB-4 is superior with AUROC 0.861.130 In addition further combination of MR elastography (MRE)-based MASH score using 3 demographic factors, 2 laboratory variables, and MRE by Lee YS et al were able through a score derivation to exclude steatohepatitis at a cutoff of 0.37 with a sensitivity of 91% but a specificity of 55%.131 Among a biopsy proved MASLD, MRE differentiated between MASH and MASLD with accuracy of AUROC 0.74; however, when it was combined with the technique of (proton density fat fraction) MRI-PDFF to differentiate between no to mild versus advanced degrees of fibrosis the accuracy remains the same. MRE-PDFF combined with serum AST improved accuracy to 0.83.132 Finally for assessment of fibrosis ≥ F2, MRE and FIB-4 in a clinical prediction model that was able to rule in fibrosis ≥ 3.3 kpa and ≥ 1.6 kpa, respectively, with PPV of (91 to 97%) and AUROC accuracy of (0.84–0.90).133
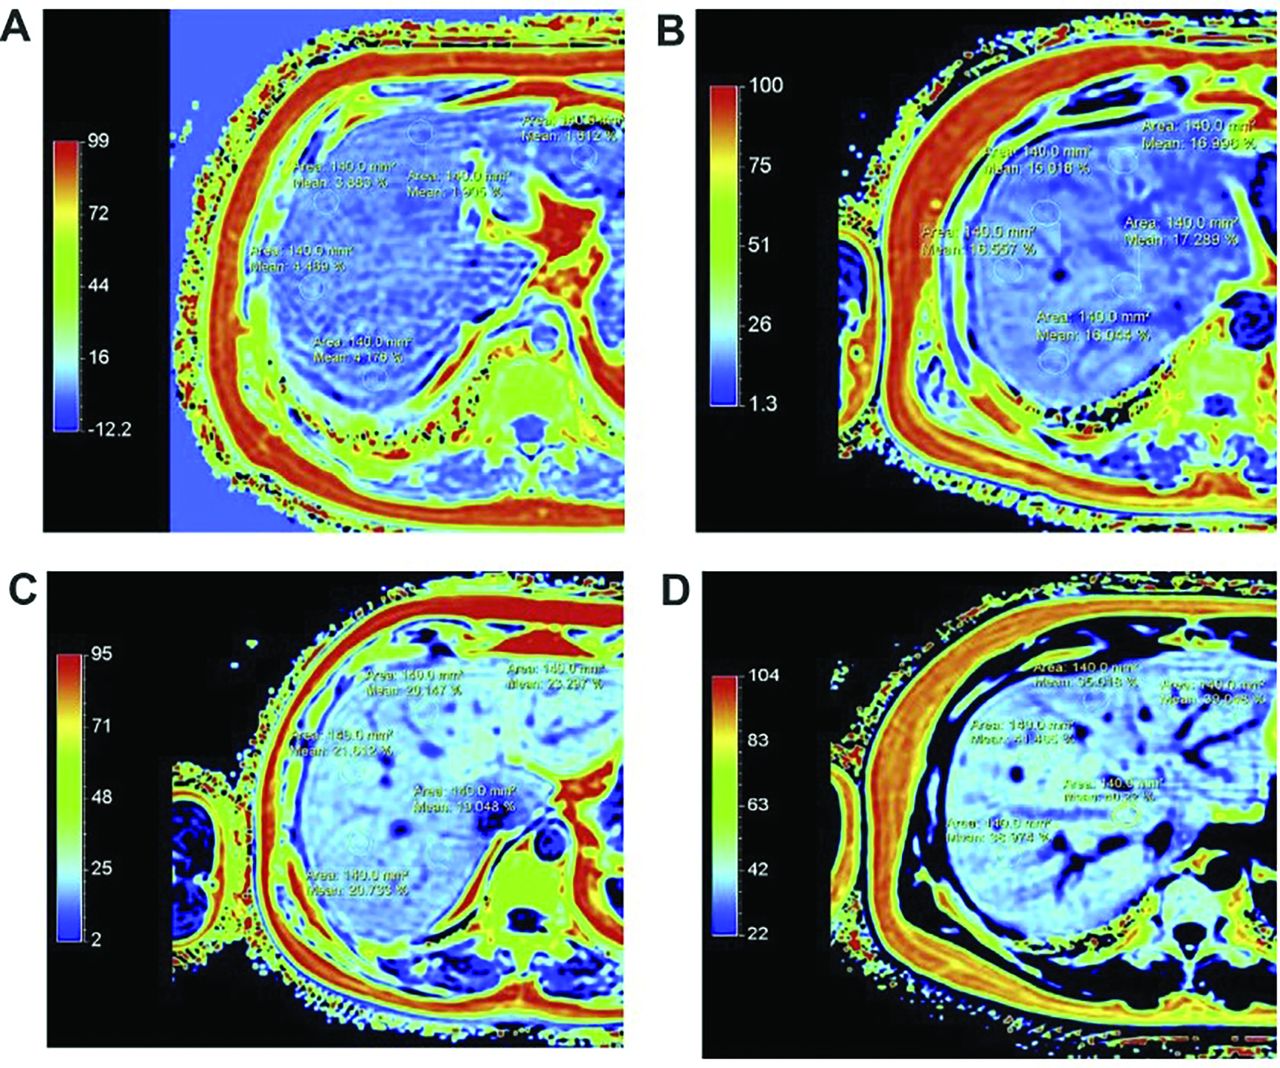
MR spectroscopy is found to correlate significantly the histologic grade of steatosis and fibrosis (r = 0.83–0.94) when using 1H MRS technique.134,135 The 2 Point and Multiple echo Dixon sequence is another promising MRI technique with high correlation (r = 0.90) to histologic reference (r = 0.88) of steatosis.136 Of note, the confounding factors are hepatic iron deposition, hepatic inflammation, and fibrosis. This is improved when proton derived fat fraction is combined with MRS, and excellent correlation exists between MRS-PDFF and MRI-PDFF with high sensitivity, specificity, and NPV of 97%, 100%, and 92.6%, respectively.137 MRI-PDFF (Figure 2) stands up as a highly accurate technique alone and in combination with blood biomarkers in quantifying liver fat138 and on follow-up after therapeutic interventions with high histologic correlations.139

MRI-proton density fat fraction (MRI-PDFF). (A) Normal MRI-PDFF with PDFF < 6.5%; (B) MRI-PDFF with Grade 1 Fatty Liver [> 6.5% and < 17.4%]; (C) MRI-PDFF with Grade 2 Fatty Liver [> 17.4% and < 22.1%]; (D) MRI-PDFF with Grade 3 Fatty Liver [> 22.1%]. Courtesy of Dr. Mahesh K Goenka.
Conclusion
MASLD is a wide spectrum disease between steatosis and advanced fibrosis. The latter is a stage that is significantly associated with liver-related morbidity and mortality that carries a significant burden. The available diagnostic methods for the family physician include readily available office-based calculations of blood biomarkers whose accuracy may be impacted with indeterminate scores, using an additional method of combing an Imaging test in whom MRI-PDFF that is accurately able to quantify liver fat is a possible, and precise diagnostic workup. Bedside transient elastography is instantaneously useful in providing a measurement, but BMI is a limiting factor. Current literature and recent guidelines recommend liver biopsy as the standard to confirm suspicions of advanced fibrosis.140 Currently, there are no screening tests for the early diagnosis of MASLD or metabolic-associated fatty liver disease. It is noteworthy that a graded diagnostic algorithm is needed, and incorporating novel markers, LSM/VCTE, and readily available simple fibrosis markers is encouraged in the future. As of now, there are several inherent disadvantages when using the fibrosis markers. These may be rectified with a combination of higher cutoff values for diagnosis with or without another method of fibrosis assessment such as LSM/VCTE and radiologic techniques. Future research is needed to validate more novel markers that reflect fibrogenesis.
Notes
This article was externally peer reviewed.
Funding: None.
Conflict of interest: None.
To see this article online, please go to: http://jabfm.org/content/37/4/753.full.
- Received for publication January 6, 2023.
- Revision received April 21, 2023.
- Revision received February 4, 2024.
- Accepted for publication February 12, 2024.
References
- 1.
- 2.
- 3.
- 4.
- 5.
- 6.
- 7.
- 8.
- 9.
- 10.
- 11.
- 12.
- 13.
- 14.
- 15.
- 16.
- 17.
- 18.
- 19.
- 20.
- 21.
- 22.
- 23.
- 24.
- 25.
- 26.
- 27.
- 28.
- 29.
- 30.
- 31.
- 32.
- 33.
- 34.
- 35.
- 36.
- 37.
- 38.
- 39.
- 40.
- 41.
- 42.
- 43.
- 44.
- 45.
- 46.
- 47.
- 48.
- 49.
- 50.
- 51.
- 52.
- 53.
- 54.
- 55.
- 56.
- 57.
- 58.
- 59.
- 60.
- 61.
- 62.
- 63.
- 64.
- 65.
- 66.
- 67.
- 68.
- 69.
- 70.
- 71.
- 72.
- 73.
- 74.
- 75.
- 76.
- 77.
- 78.
- 79.
- 80.
- 81.
- 82.
- 83.
- 84.
- 85.
- 86.
- 87.
- 88.
- 89.
- 90.
- 91.
- 92.
- 93.
- 94.
- 95.
- 96.
- 97.
- 98.
- 99.
- 100.
- 101.
- 102.
- 103.
- 104.
- 105.
- 106.
- 107.
- 108.
- 109.
- 110.
- 111.
- 112.
- 113.
- 114.
- 115.
- 116.
- 117.
- 118.
- 119.
- 120.
- 121.
- 122.
- 123.
- 124.
- 125.
- 126.
- 127.
- 128.
- 129.
- 130.
- 131.
- 132.
- 133.
- 134.
- 135.
- 136.
- 137.
- 138.
- 139.
- 140.