
Abstract
Purpose: The demand for comprehensive primary health care continues to expand. The development of team-based practice allows for improved capacity within a collective, collaborative environment. Our hypothesis was to determine the relationship between panel size and access, quality, patient satisfaction, and cost in a large family medicine group practice using a team-based care model.
Methods: Data were retrospectively collected from 36 family physicians and included total panel size of patients, percentage of time spent on patient care, cost of care, access metrics, diabetic quality metrics, patient satisfaction surveys, and patient care complexity scores. We used linear regression analysis to assess the relationship between adjusted physician panel size, panel complexity, and outcomes.
Results: The third available appointments (P < .01) and diabetic quality (P = .03) were negatively affected by increased panel size. Patient satisfaction, cost, and percentage fill rate were not affected by panel size. A physician-adjusted panel size larger than the current mean (2959 patients) was associated with a greater likelihood of poor-quality rankings (≤25th percentile) compared with those with a less than average panel size (odds ratio [OR], 7.61; 95% confidence interval [CI], 1.13–51.46). Increased panel size was associated with a longer time to the third available appointment (OR, 10.9; 95% CI, 1.36–87.26) compared with physicians with panel sizes smaller than the mean.
Conclusions: We demonstrated a negative impact of larger panel size on diabetic quality results and available appointment access. Evaluation of a family medicine practice parameters while controlling for panel size and patient complexity may help determine the optimal panel size for a practice.
- Diabetes Mellitus
- Family Practice
- Group Practice
- Patient Care
- Patient Satisfaction
- Family Physicians
- Primary Health Care
- Regression Analysis
- Retrospective Studies
While the delivery of health care to patients and families intensifies each year, the principles of primary care remain the same: to provide continuous and comprehensive primary health care for individuals and families in the local community.1,2 Demand for primary care services continues to increase as Baby Boomers age (with increased needs for both preventive care and chronic disease management).3 Determining the size of the panel of patients that a family physician can care for has important implications, such as an impact on workforce staffing, quality outcomes, and access to care.2,4,5 While one recent study demonstrated no consistent relationship between panel size with chronic disease care or access to care,6 others have demonstrated a significant relationship between increased panel size and shorter clinical visits,7 along with higher specialty referral rates.8 Previous models have attempted to calculate an individual physician's panel size based on the demand of their particular patients and the capacity of the physician to meet that demand.4,9,10
A number of strategies have been developed to manage the increased burden of patient needs on primary care physicians. The development of team-based practice allows for an improved capacity to care for patients within a collective, collaborative environment.2,3,5,11⇓–13 Optimal care team composition varies depending on the patient population and practice resources.14⇓–16 The common goal is to have all team members functioning at the top of their respective licenses and skill sets to meet patients' needs in a value-based manner. Ancillary team members (across multiple teams) assist providers with key tasks related to prescription renewal, care coordination, and other indirect and direct patient care activities. Our current care team model includes 2 to 4 family physicians and 2 to 4 nurse practitioners or physician assistants (each with varying clinical time), with a registered nurses and several licensed practical nurses per care team. In addition, appointment coordinators, clinical assistants, integrated behavioral health providers (consisting of psychiatrists, psychologists, and social workers), pharmacists, panel managers, and care coordinators supported the practice at all sites. The physician practices were also supported by standardized processes for triage, prescription renewal, communication of normal results to patients, population management, an anticoagulation clinic, retail clinic access for acute care needs, and nonvisit care.
Nonvisit care and the more robust use of a patient electronic portal can be implemented to assist with management of a patient's care by the physician and the care team.2,4 Patient portals within the electronic medical records have become increasingly common and are often more efficient than the telephone for both patients and providers.17 Although nonverbal cues are lost with portal communication, patients have generally been quite satisfied with portal use.18 These various nonvisit care options give the provider and other care team members time to manage their practice needs asynchronously and independent of a face-to-face clinical visit. These strategies allow expanded care capacity by primary care physicians and nonphysician team members through a common infrastructure that supports all providers.
Changes in health care utilization, systems, and regulations require practice changes at clinical sites. Since individual physician panel capacity no longer adequately measures capacity that has been expanded by the use of a team, our objective was to determine the relationship between panel size and access, quality, patient satisfaction, and cost in a large family medicine group practice using a team-based care model. While our aim was to define an optimal and individual physician panel size for our team-based practice, we also endeavored to model methods that could be generalized to other clinical practices to help evaluate their family medicine panel sizes with clinical outcomes.
Methods
The study was performed in the Department of Family Medicine of the Mayo Clinic in Rochester, Minnesota, which provides primary care to clinic employees and residents of southeastern Minnesota. The multisite practice includes an urban medical center clinic and 2 satellite community clinics. Of the 3 sites included in this study, there were a total of 9 care teams: 1 site had 4 teams and the others had 2 or 3. In our practice, a family physician would have 45 minutes of nonvisit care time and 3 hours 15 minutes of patient contact time per half day. For a 1.0 full-time equivalent (FTE), a family physician would have 32.5 hours of direct patient contact time. In general, all other departmental time commitments (research, educational, administrative) were allotted in 0.05 FTE increments (1 half-day per week).
We retrospectively analyzed data that were routinely collected for each family physician. Physicians who were recently hired or did not have a patient panel were excluded from the study. All physician practices were “open” and still having new patients assigned to their panels. The work week was defined as 1.0 FTE with 5 full days of outpatient clinical activity. Attributing a patient to a particular physician has been a high priority for our organization for many years. Thus in our system we have consistent records of who the empanelled patients are. In addition, the panels were consistently maintained to remove inactive patients or those who have left the practice. All the family physicians in this study cared for patients of all ages, but not all physicians provided pregnancy or maternity care. Individual practices varied in the characteristics of the amount of procedures performed, average patient age, patient genders (percentages), amount of time dedicated to indirect patient care, and individual physician FTE. The total panel size of patients assigned to a provider was adjusted by dividing the actual panel size by the mean proportion of time during the week the provider was available to provide outpatient care. The cost of care was assessed as per member per month (PMPM) charges. Access was measured as the number of days until the third available appointment slot (exclusive of same-day appointment slots) and by the appointment fill rate (percentage). The quality metric was the proportion of diabetic patients achieving the combined outcome of hemoglobin A1c <8.0%, blood pressure <140/90 mmHg, and low-density lipoprotein cholesterol <100 mg/dL (D3). Patient experience was measured by the proportion of top-box ratings in the Avatar patient satisfaction survey. Cross-sectional monthly or quarterly data were compiled for October 2014. However, because of team reorganizations that occurred between June and October 2014, inaccuracies in PMPM data were identified. Consequently, PMPM data from the first quarter of 2014 were used.
In an effort to compare the patient mix of a specific provider's panel, we used a panel complexity score that was calculated based on the Centers for Medicare and Medicaid Services Hierarchical Condition Categories (CMS-HCC). The CMS-HCC is a risk adjustment model that was developed in 2004.19 The model was used to adjust capitation payments to private health care plans for the health expenditure risk of their enrollees and is now used by other organizations as a relative measure of expected health care expenditure and a surrogate for complexity. While initially developed for patients aged ≥65 years, it does not account as well for complexity in younger patients. Data elements used to calculate this score include patient age, patient sex, and billed diagnostic codes.20 Patient complexity was then standardized across the institution, with the institutional median defined as 1. While primary care patients in a tertiary academic medical system generally have complexity scores below unity, it does allow for physician practices within the department to be compared.
Data for the quality (D3) and cost metrics were assigned a rank score. The physician with the lowest quality metric was scored “1,” whereas the physician with the best ranking was “36.” Similarly, the physician with the lowest PMPM cost was ranked as a “1” and the highest as “36.”
Linear regression analyses were performed to compare adjusted physician panel sizes with the outcome variables. The analyses were adjusted for patient complexity (using the CMS-HCC scores) of provider panels. A variable outlier status was determined as either ≤25th or >75th percentile, depending on the variable. Thus, for our quality metric, >75th percentile was considered as providing excellent quality care, whereas ≤25th percentile was not. Logistic regression modeling was performed for the outcomes of outlier status, controlling for patient complexity scores. Statistical analysis was performed using MedCalc Software (version 14.12.0; www.medcalc.org). P < 0.05 was considered significant.
The Mayo Institutional Review Board considered this project consistent with quality improvement and exempt from review.
Results
Of the physicians in our study, 38.8% were female (n = 14). The mean (nonadjusted) panel size of our practice was 1396 patients (range, 768-1921 patients). Of the 36 family physicians with panels and complete data, the mean (± standard deviation) FTE of clinical availability was 0.49 ± 0.13, with an adjusted panel size of 2959 ± 629 patients (Table 1). The average complexity score, third available appointment, percentage daily appointment fill rate, and patient satisfaction survey results are shown in Table 1.
Variables (Means) among Departmental Family Physicians
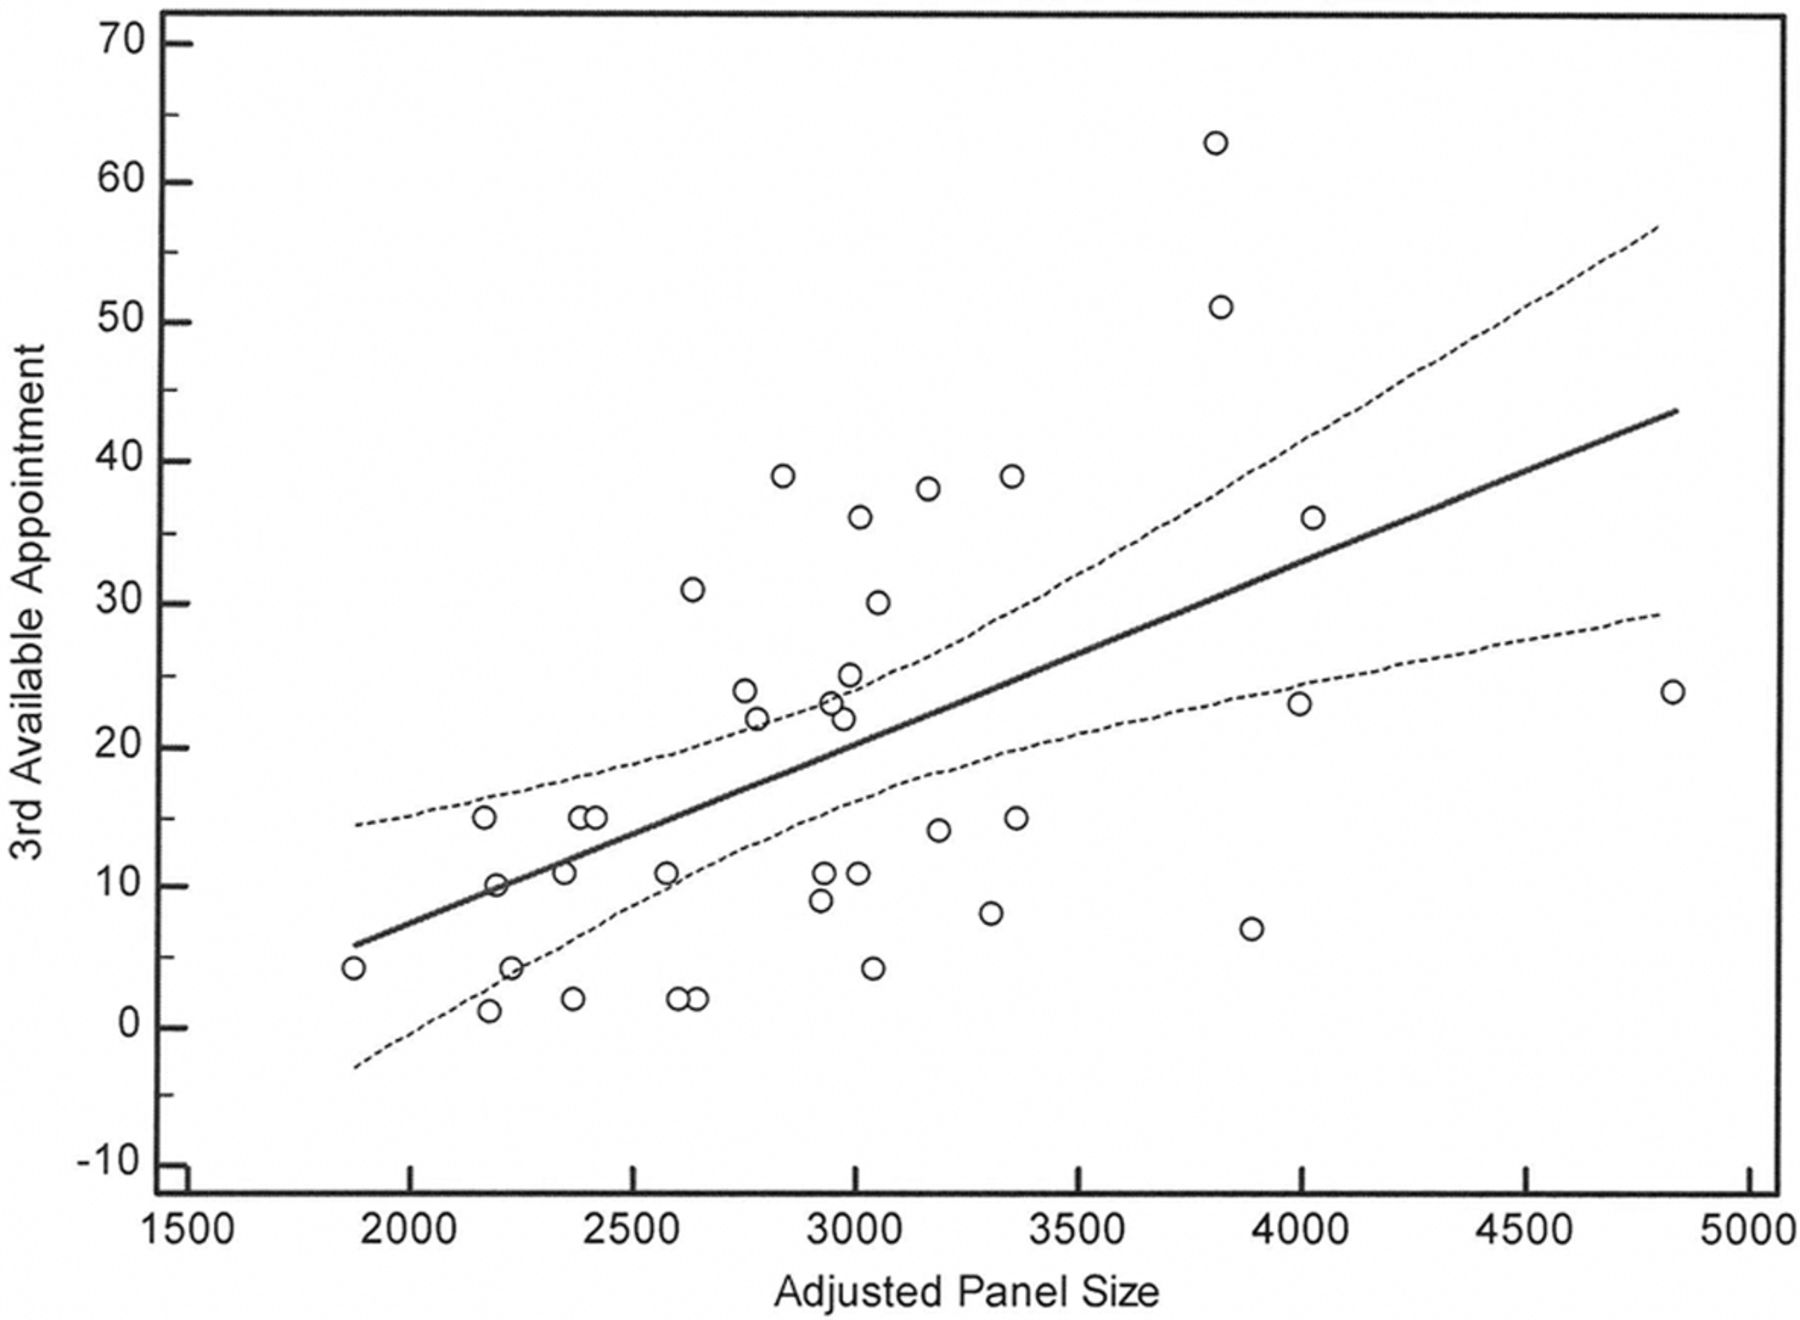
Using regression analysis (while controlling for patient complexity), the time to the third available appointment (P < .01; Figure 1) and the quality ranking (P = .03; Figure 2) were negatively associated with increased panel size. Patient satisfaction, cost rankings, and percentage fill rate were not affected by panel size (Figures 3 to 5). Actual cost and quality data were also analyzed and demonstrated consistent results.

Effect of adjusted panel size on third appointment availability (days), controlling for patient complexity (P < .01).

Effect of adjusted panel size on physician quality ranking, controlling for patient complexity (P = .03).

Effect of adjusted panel size on patient satisfaction, controlling for patient complexity (P = .42).

Effect of adjusted panel size on percentage daily fill rate, controlling for patient complexity (P = .06).

Effect of adjusted panel size on cost ranking, controlling for patient complexity (P = .24).
Logistic regression modeling was done for the likelihood of adverse outcomes, specifically outlier status for D3 ranks, third available appointment, patient satisfaction scores, and cost rankings. A physician-adjusted panel size above the mean (2959 patients) was associated with a greater likelihood of poor-quality rankings (≤25th percentile) than those below the mean panel size (odds ratio, 7.61; 95% confidence interval, 1.13–51.46). Panel size above the mean was also more likely to have poor (>75th percentile) access to the third available appointment (odds ratio, 10.91; 95% confidence interval, 1.36–87.26) than those physicians below the mean adjusted panel size. Daily fill rate, cost ranks, and patient satisfaction scores were not associated with outlier status (Table 2).
Odds Ratio of Outcomes for Patient Satisfaction, Quality, Access, and Cost, by Panel Size
However, decreasing the adjusted panel size (to the 25th percentile of the adjusted panel sizes, or 2496 patients) did not significantly improve the odds of exceptional care or significantly lower costs (Table 2). This may reflect our institutional system bias. The optimal adjusted panel size for a physician may be <2496 patients, but we were unable to prove that with our current data set.
Discussion
In this study, increased adjusted (for FTE) family physician panel size was associated with worse access to appointments and diabetes quality metrics. Costs of care, patient satisfaction, and appointment fill rate were not associated with family physician panel sizes. No clear inflection point in the relationship of panel size with any outcome was evident within the range of panel sizes in our practice. Thus we were unable to clearly define an optimal family medicine panel size in our team-based environment, which was 1 of the goals of our study. However, we could use this model to estimate the effect a particular adjusted panel size would likely have on quality and access outcomes across the practice. Changing the panel size is one means of potentially achieving a desired access or quality outcome.
In a 2016 cross-sectional study in Ontario, Canada, Dahrouge et al6 demonstrated that there was no consistent relationship of family medicine panel sizes and management of multiple diabetes, asthma, or congestive heart failure clinical outcomes for unadjusted (by FTE) physician panels of 1200 to >3600 patients. While they did not measure outpatient access, admissions and emergency department visits were increased among patients who were empanelled to physicians with a larger patient panel. Similarly, our access metrics for the mean time to the third available (nonacute) appointment were—at 19 days—not ideal at baseline, but they demonstrated a significant association that was negatively affected by increased panel size.
Outcomes related to access, quality, cost, and patient satisfaction are key metrics in primary care. Many family medicine clinics already track these or similar metrics. Ongoing work is being done by us and others to find optimal staffing ratios for the care team.21,22 While the mechanism that we used to determine patient complexity is unique to our institution (because of the definition of the median patient as a complexity level of 1) and does not allow for a comparison of the complexity of this primary care practice with another, a previous study demonstrated that multiple mechanisms for classifying patients by health care stratification resulted in remarkably similar outcomes.23 Thus the methodology of using readily available practice data (while controlling for panel complexity) to evaluate clinical outcomes within a group of physicians should be generalizable.
The strength of our study is that it provides to physician group practices a mechanism to evaluate their current system and determine how panel size affects specific outcomes within their organization, based on the outcomes they desire. This can provide guidance to determine the optimal panel size for physicians and care teams by staffing for the population of patients. However, increasing provider-adjusted panels above certain thresholds may create potential risk to quality and access. The variability in outcomes between providers with similar panel sizes indicates that some improvement in outcomes could be gained by studying the best practices of high performers. Greater standardization of these practices could reduce variability and lead to more predictable relationships between panel sizes and outcomes of interest to practices.
The study was limited in that it was from a single institution, so the generalizability of the practice data may not be possible. However, the methodology and lessons learned are generalizable. In addition, staffing ratios of team members and individual team efficiencies were not uniform nor consistent across sites. No measure was available to assess team function and efficiency. Access in either a patient-centric or provider-centric model was not available for analysis, so no conclusions can be made about the effects of panel size acute (same-day) access to an individual provider. The cross-sectional method of data collection does not capture the temporal variability of the outcomes over time. Individual practice characteristics were not evaluated, with patient and individual physician variables intentionally not obtained, as the intent of the study was to evaluate the “average” family physician in our group. Other unmeasured variables likely also affect the outcomes reported here. Specifically, patient continuity (with a physician and with the provider team), physician continuity (the percentage of patients the physician sees who are from their panel), and the utilization of nonvisit care were not evaluated. The relationship of practice outcome and panel size may differ in practices where physicians have a greater proportion of clinical time. However, adjusting panel sizes to an FTE was used to allow as direct as possible comparisons with other practices. Future studies could be performed to determine team-specific outcomes and capacity.
Many of the metrics in this study were not directly affected by the size of a physician's adjusted panel. An optimistic explanation could be that prior system changes have allowed this clinical practice to adapt to the current panel size for the physicians without affecting costs, appointment fill rates, and patient satisfaction. Future systems changes may allow for increased panel size or capacity without sacrificing quality or access. However, it would be important to monitor these over time.
Conclusions
When adjusting for patient complexity, we found no relationship between family physician patient panel size and costs, appointment fill rates, or patient satisfaction. We were able to demonstrate a negative impact of increasing panel size on diabetic quality results and available appointment access. Future care processes could be implemented to improve access and quality metrics while allowing increased panel growth. Evaluating family medicine practice parameters with this methodology while controlling for panel size and patient complexity may help guide practice change.
Notes
This article was externally peer reviewed.
Funding: This study was funded by support from the Department of Family Medicine, Mayo Clinic.
Conflict of interest: none declared.
- Received for publication November 24, 2015.
- Revision received February 23, 2016.
- Accepted for publication February 26, 2016.
References
In this issue


Jump to section
Related Articles
Cited By...
- Advancing Family Medicine in a Model Unit: A Living Lab for Health Care Design and Innovation
- Revitalizing Primary Care, Part 1: Root Causes of Primary Cares Problems
- Workload and patterns of care in the Timmins Family Health Team in Ontario
- Panel Size, Clinician Time in Clinic, and Access to Appointments
- Research in Family Medicine by Family Physicians for the Practice of Family Medicine