Article Text

Extract
Our objective was to determine the test and treatment thresholds for common acute primary care conditions. We presented 200 clinicians with a series of web-based clinical vignettes, describing patients with possible influenza, acute coronary syndrome (ACS), pneumonia, deep vein thrombosis (DVT) and urinary tract infection (UTI). We randomly varied the probability of disease and asked whether the clinician wanted to rule out disease, order tests or rule in disease. By randomly varying the probability, we obtained clinical decisions across a broad range of disease probabilities that we used to create threshold curves. For influenza, the test (4.5% vs 32%, p<0.001) and treatment (55% vs 68%, p=0.11) thresholds were lower for US compared with Swiss physicians. US physicians had somewhat higher test (3.8% vs 0.7%, p=0.107) and treatment (76% vs 58%, p=0.005) thresholds for ACS than Swiss physicians. For both groups, the range between test and treatment thresholds was greater for ACS than for influenza (which is sensible, given the consequences of incorrect diagnosis). For pneumonia, US physicians had a trend towards higher test thresholds and lower treatment thresholds (48% vs 64%, p=0.076) than Swiss physicians. The DVT and UTI scenarios did not provide easily interpretable data, perhaps due to poor wording of the vignettes. We have developed a novel approach for determining decision thresholds. We found important differences in thresholds for US and Swiss physicians that may be a function of differences in healthcare systems. Our results can also guide development of clinical decision rules and guidelines.
- EPIDEMIOLOGY
- GENERAL MEDICINE (see Internal Medicine)
- PRIMARY CARE
- STATISTICS & RESEARCH METHODS
Acknowledgments
The authors would like to thank the physicians who took the time to complete our survey, in particular the members of the Swiss Sentinella Network.
Statistics from Altmetric.com
Introduction
The threshold model of disease1 describes two thresholds for clinical decision-making. The test threshold is the point at which the clinician is at equipoise regarding the decision to rule out the disease or gather additional data. The treatment threshold is the point at which the clinician is at equipoise regarding the decision to gather additional data or to rule in disease and initiate treatment. Thus, there are three options for any patient presenting with an undifferentiated symptom: the probability that the disease falls below the test threshold and can be ruled out; the probability falls above the treatment threshold and treatment may be initiated; or it falls between the thresholds and more information is needed. These thresholds have important implications for physicians as well as for those developing clinical decision rules and practice guidelines.
A limited body of previous research has used different approaches to determine these thresholds. Pauker and Kassirer1 describe a decision-analytic approach that calculates the thresholds based on the probability of disease, the accuracy of the diagnostic test, and the risks and benefits of treatment and testing in those with and without disease. Eraker et al2 build on this approach, using the expected value of clinical information to determine a range of thresholds based on the relationship between the benefit/cost ratio and the prior probability of disease. Eisenberg and Hershey3 presented physicians with a clinical vignette and asked them to make decisions regarding testing, treatment or neither; he then provided additional information about the case and asked them the same question again. This information was used to determine a plausible range for each physician's test and treatment thresholds. Young et al4 proposed an approach to aggregate the estimates of groups of physicians. Another approach used cases with a known probability of disease, asked physicians to make a management decision and used ordinal regression to estimate the thresholds.5 ,6 Finally, a study of decision-making methods regarding tuberculosis testing found that the intuitive thresholds set by clinicians were much higher than those calculated using a decision-analytic method, perhaps because the model omitted externalities, such as financial and political pressures, and concerns about drug resistance.7
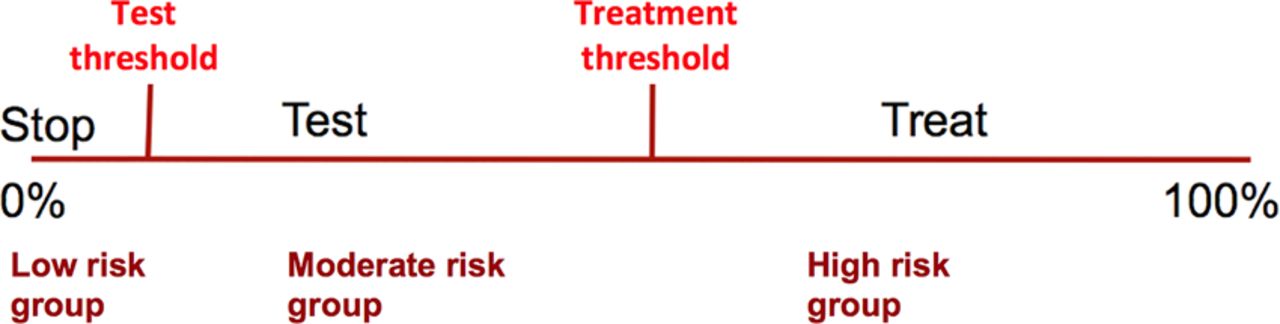
Clinical decision rules are increasingly reported in the medical literature and have the potential to improve clinical practice.8 After applying decision thresholds, these rules often identify low-risk, moderate-risk and high-risk groups for a particular condition, such as deep vein thrombosis (DVT), pulmonary embolism, strep throat or influenza.9–13 To be most useful, these risk groups should correspond to the region below the test threshold for the low-risk group, between the thresholds for the moderate-risk group and above the treatment threshold for the high-risk group,14 as shown in figure 1. Yet, the location of those thresholds has not been studied in routine practice for most conditions.15 It is also not clear whether these thresholds differ between countries, which may have different standards of care. For example, European physicians typically use fewer point of care (‘near patient’) tests than their North American counterparts.

Illustration of the threshold model, and how it can be used to inform design of a clinical decision rule.
By using online clinical vignettes, we have the ability to dynamically vary the probability of disease for each participant, giving us a novel way to explore test and treatment thresholds for common conditions. In this report, we describe a pilot project to develop this approach using physician responses to dynamically varied clinical vignettes.
Methods
Clinical scenarios
This study was approved by the Human Subjects Committee of the University of Georgia. We developed a series of brief clinical vignettes for common conditions, favouring diseases for which there are validated clinical decision rules (table 1). The probability of disease for each vignette was randomly selected from a clinically plausible range of probabilities prespecified by the principal investigator. Scenarios for influenza, acute coronary syndrome (ACS) and pneumonia offered three possible actions: rule the disease out, order additional tests and initiate treatment. The scenario for DVT only offered the options of ruling out disease or ordering diagnostic studies (to explore the test threshold), while the scenario for urinary tract infection (UTI) only offered the option of diagnostic testing or empiric therapy (to explore the treatment threshold). The wording for the ACS scenario varied slightly between emergency physician and primary care physicians to assure them that it was clinically realistic. Contextual information, such as the cost of tests or treatments, was not presented as part of the scenarios. The website used to gather data for this study can be seen at http://ebp.uga.edu/ebpquiz/?key=pjuxzjdcrefoxddiegjnshbhui; a sample screen image is shown in appendix A (web only).
Clinical scenarios, decision options and the range of disease probabilities randomly presented to participating physicians
Participants
We recruited a convenience sample of primary care and emergency physicians. An announcement was made at the continuing education conferences sponsored by the Arizona Academy of Family Physicians (n=220) and the Cleveland Clinic (n=110), courses that are attended primarily by family physicians but also by some general internists and nurse practitioners. We also emailed an invitation to approximately 2000 physicians who are members of the American Academy of Family Physician's National Research Network. Finally, we invited 175 Swiss primary care physicians who participate in the ‘Sentinella’ national influenza surveillance network.
Data collection
After providing informed consent, participants were asked their age, sex, specialty, year of graduation from medical school, country of residence and the percentage of their professional effort devoted to patient care. Based on the response to the question about specialty, they were given the appropriate scenarios for primary care or emergency department clinicians.
Analysis
Test and treatment thresholds for US and Swiss clinicians were estimated by adapting the method of Plasencia et al.5 In order to estimate the test threshold we estimated the following logistic regression model: 1
1
In this equation p1 is the probability of not ruling out (testing or treating); x is the disease probability; z the dichotomous variable for country (0=Swiss; 1=USA); and a1, b1 and c1 are the model coefficients. A prediction  of the probability of not ruling out was obtained according to the model as a function of the disease probability x and for each of the two values of z. The test threshold was then defined as the disease probability xtest corresponding to a 1 in 2 probability of not ruling out:
  .
.
The test threshold was thus obtained by inverting (1) and replacing p1 with 0.5: where
where  ,
,  and
and  were the coefficients estimates of model (1).
In order to obtain the treatment threshold we estimated a second logistic model: 2where p2 was the probability of treating.
A prediction  of the probability of treating was obtained as a function of x. The treatment threshold was then defined as the disease probability xtreat corresponding to a 1 in 2 probability of treating:
  .
.
The treatment threshold was thus obtained by inverting (2) and replacing p2 with 0.5: where
where  ,
,  and
and  were the coefficients estimates of model (2).
CIs for each threshold were obtained adapting the method of Plasencia and colleagues (see appendix B web only), and US and Swiss test and treatment thresholds were compared. When decisions were made that seemed inconsistent with good practice (eg, excluding pneumonia for a patient with a stated disease probability of 60%), values were removed from the thresholds’ analysis. Acceptable probabilities were predefined by the investigators (see appendix C web only).
Basic descriptive statistics were performed using Stata V.12.1 (StataCorp Inc, College Station, Texas, USA). Logistic regressions and graphics were performed using R package (V.2.15.1, GNU Project, University of Auckland, New Zealand).
Results
A total of 240 physicians responded to the invitation to participate in the study, of whom 200 provided usable data for analysis. The remainder used an old or non-standard web browser, and the website was unable to receive their data except as NULL values. The response rate for Swiss physicians was 55%. The response rate for US physicians could not be calculated as invitations to participate were extended to physicians in continuing education courses, in the author's personal network and in practice-based research networks. The characteristics of the 200 participants are summarised in table 2. Overall, participants responded to a total of 915 clinical scenario. We excluded 37 (4%) scenarios where the physician made a decision that was inconsistent with good clinical practice, based on a prespecified set of minimal criteria (see appendix C web only).
Characteristics of 200 participating physicians
The distributions of probabilities for each scenario for US and Swiss physicians are displayed in box plots in figures 2A–E. Each figure shows the number of physicians choosing each clinical decision and the quartiles of probabilities for each decision and by country. For example, for influenza (figure 2A), the probability of influenza was less than 1% for most physicians who ruled out the diagnosis. Among those who ordered a rapid test, the probability of disease ranged from 5% to 90%. The range was especially broad for US physicians.
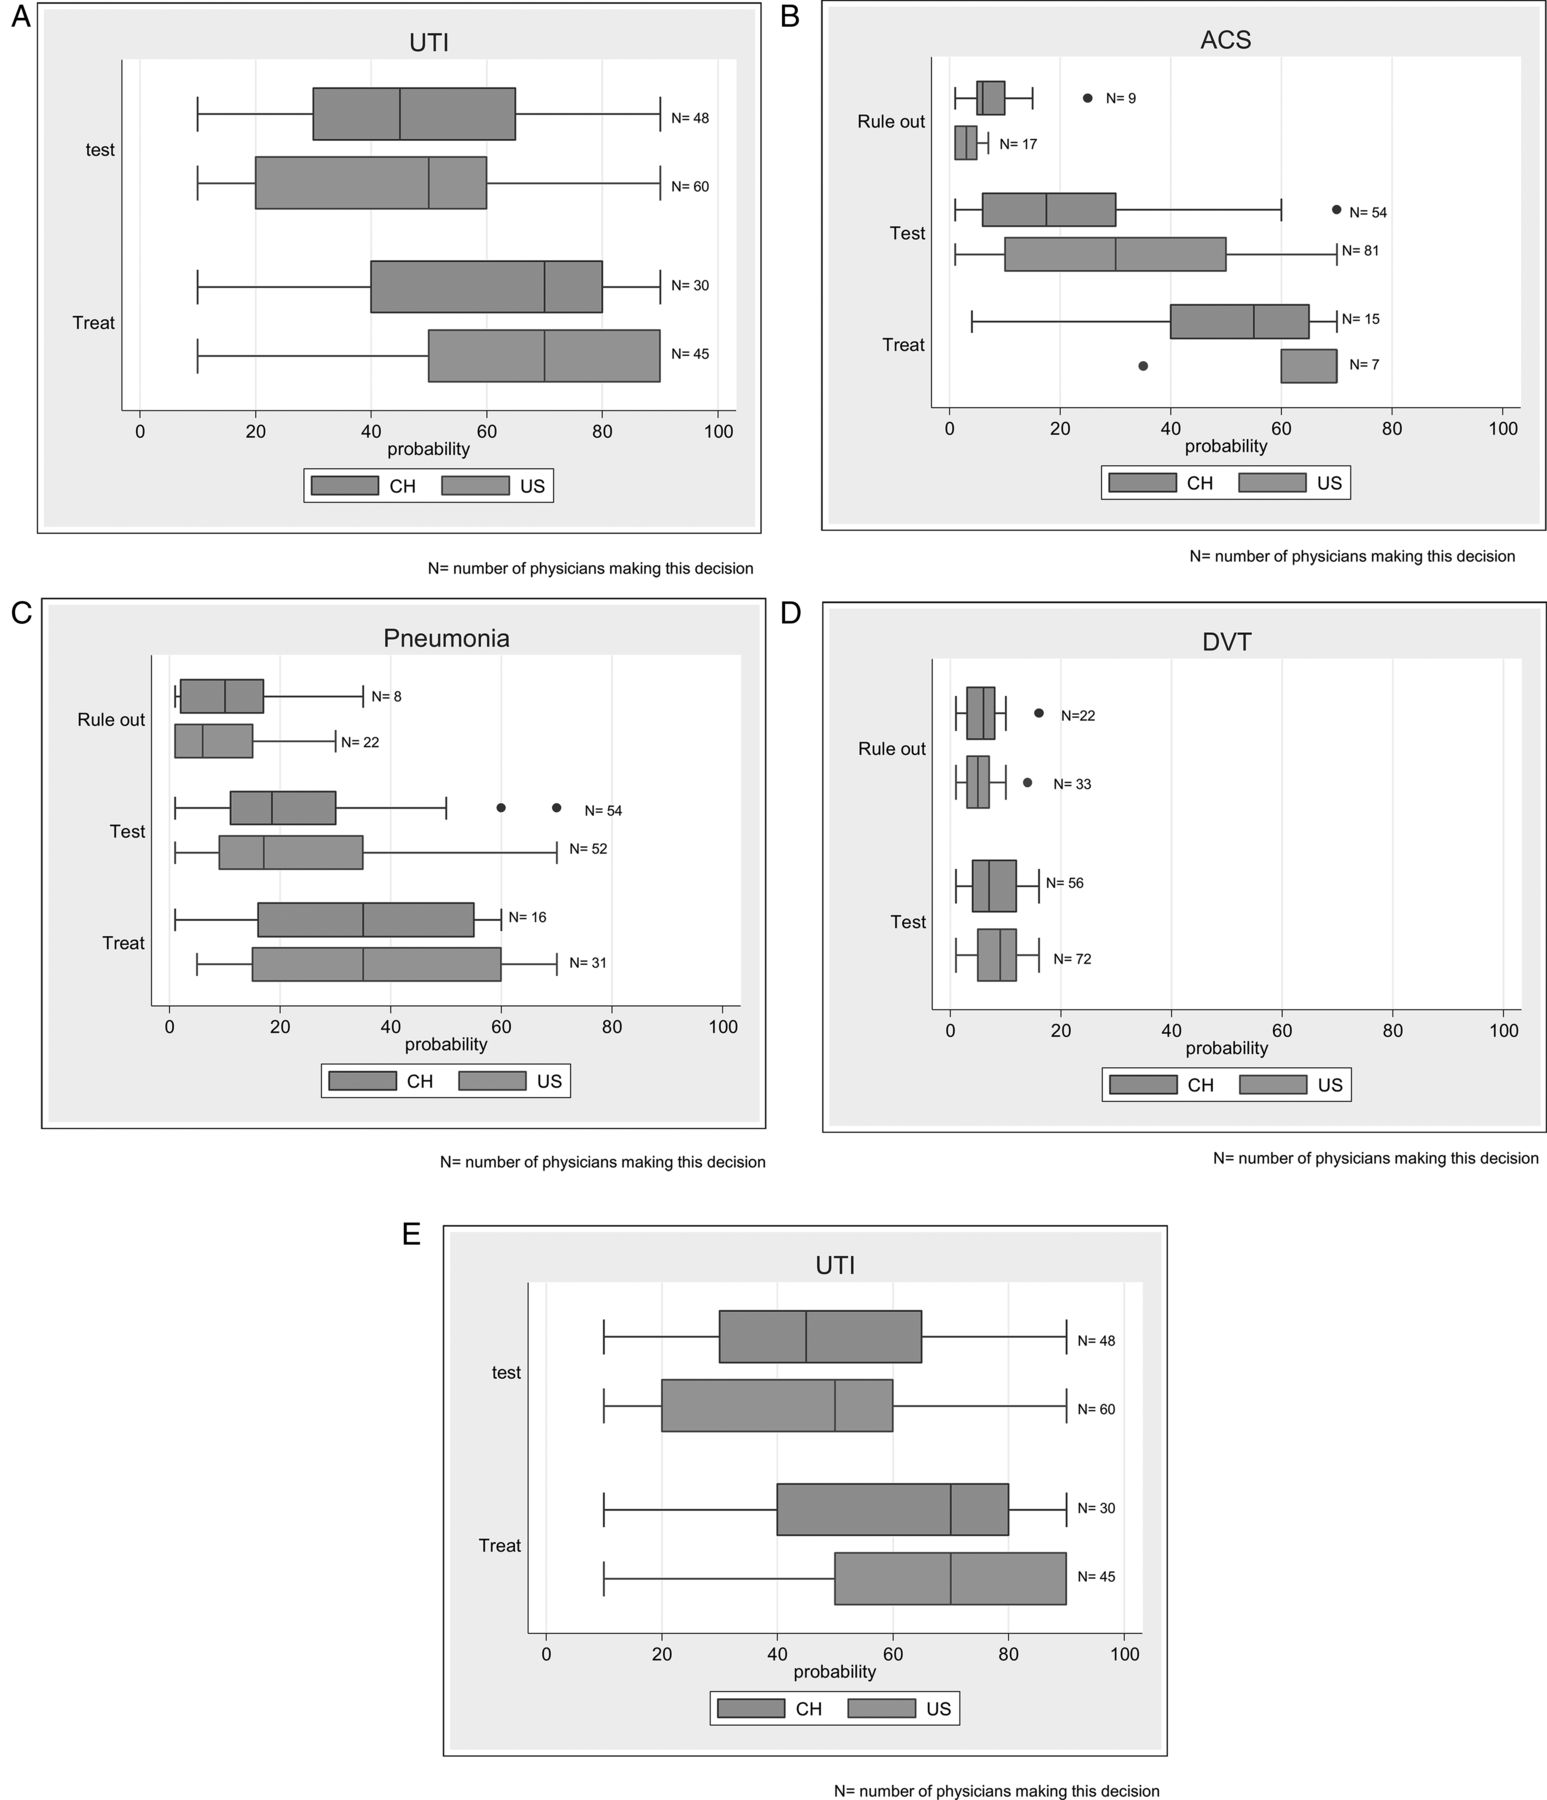
Box plots displaying the distribution of probabilities for each scenario, by decision and by country. (A) Influenza, (B) acute coronary syndrome (ACS), (C) pneumonia, (D) deep vein thrombosis (DVT) and (E) urinary tract infection (UTI).
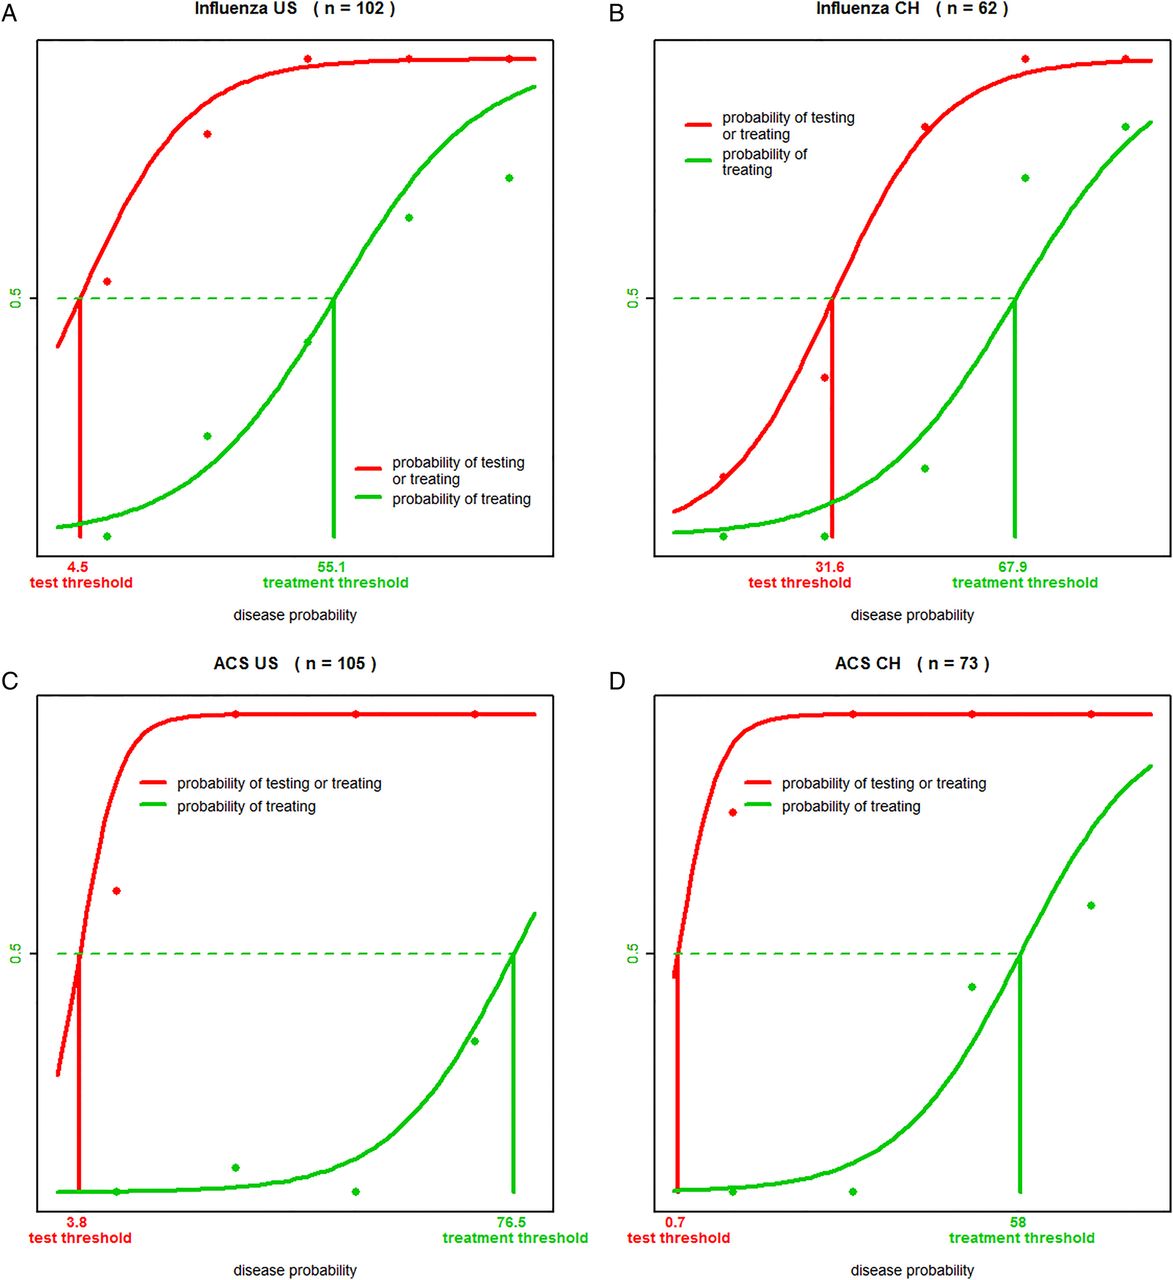
As described in the previous section, we used two separate logistic regressions in order to calculate test and treatment thresholds. For each model, the decision threshold is defined as the disease probability for which half of physicians take the decision. Figure 3A–C illustrates graphically the prediction of logistic regressions and thresholds for influenza, ACS and pneumonia; results are presented separately for each country. Test and treatment thresholds for each country and disease are detailed in table 3, along with their 95% CIs. The p values of the differences between US and Swiss test thresholds, and between US and Swiss treatment thresholds are also given in table 3 for each disease scenario.
Test and treatment thresholds and 95% CIs for USA and Swiss

Thresholds to test and treat for the different diseases and by country. (A) Influenza, (B) acute coronary syndrome (ACS), (C) pneumonia.
We found differing thresholds for US and Swiss physicians regarding influenza decisions. In particular, the test threshold was significantly higher in Switzerland than in the USA (32% vs 4.5%, p<0.001); the treatment threshold was also higher in Switzerland, but the difference was not significant (68% vs 55%, p=0.107). On the other hand, for ACS both countries were concordant with very low thresholds to initiate testing (0.7% vs 3.8%, p=0.107) and high thresholds to initiate presumptive treatments (58% vs 77%, p=0.005), reflecting both the severity of the disease (low test threshold required) and potential harmfulness of treatment (high treatment threshold required); the treatment threshold was, nevertheless, significantly higher for the US than the Swiss physicians.
In the case of pneumonia, US clinicians had a trend towards a higher test threshold and a lower treatment threshold than Swiss physicians. For DVT, test thresholds were very low and similar (3.2% for USA and 1.7% for Swiss, p=0.38), which is consistent with the recommendations derived from the Well's score, where a probability of DVT is considered to be low between 5% and 10% (<1 point out of a maximum of 8 on Well's score).9 For UTI, treatment thresholds were high and similar for the two countries (64% for USA and 73% for Swiss, p=0.34).
Discussion
We have developed and pilot tested a simple, flexible technique for determining test and treatment thresholds. The calculated thresholds have good face validity: ACS, DVT and pneumonia are more serious illnesses with a greater harm if missed than influenza and therefore, have lower test thresholds. The treatment threshold is higher for ACS than for influenza, which is also sensible since treatment of that condition has potential harms and greater diagnostic certainty is desirable.
For influenza, the test (4.5%) and treatment (55%) thresholds in the USA determined by our approach are similar to thresholds described using other techniques. For example, Rothberg et al16 studied patients over age 65 years and found that for vaccinated patients, the calculated test threshold was 10% and the treatment threshold 41%. We had previously developed and internally validated a clinical decision rule for the diagnosis of influenza,13 using thresholds of 10% and 50% based on an informal survey of primary care physicians. In these two studies, thresholds were set according to the subjective judgement of the investigators. The present work identifies more objective and consensual thresholds.
There were clear differences between US and Swiss physicians, particularly regarding influenza decision-making. Swiss physicians were much more likely to rule out influenza regardless of the probability of disease and much less likely to rule in influenza and initiate treatment empirically. This may reflect differences in the use of rapid antigen tests and anti-influenza drugs in both countries. In addition, US physicians had a higher treatment threshold for ACS than Swiss physicians, but a lower treatment threshold for pneumonia. The approach presented in this pilot study opens a new field of investigation regarding decision-making processes. Furthermore, it questions the appropriateness of universal clinical recommendations for the management of common diseases when different thresholds are observed between countries. Given the small sample size of our study, these suppositions should be considered hypothesis generating and require confirmation in subsequent larger samples.
One limitation of this study is that the probability of disease was provided to the physicians instead of letting them estimate it. This might have influenced their clinical judgement in the decision to rule out, test or treat. Indeed, these decisions are often complex and may involve subjective elements that cannot be captured by the probability alone.17 Nevertheless, this pilot study demonstrates the feasibility of using dynamically generated online clinical vignettes to assess decision thresholds. Future work should include differing clinical presentations that are more detailed and more consistent with the stated disease probability, which might allow clinicians to include other factors in the decision rather than the crude probability. Furthermore, using the method presented here, it will be also possible to investigate the factors that influence decision-making as described by Plasencia et al.5 Finally a larger sample size should allow a more detailed investigation of the different elements influencing decision-making. Alternative approaches, such as letting physicians iteratively come to a threshold by repeatedly viewing the same scenario, could also be explored. Another question is how the implicitly derived thresholds of our approach which potentially incorporate externalities, such as risk aversion in the decision, compare with more explicit approaches, such as decision analysis.
For each scenario, we observed that some physicians (4% of scenarios) made decisions that appeared to be inconsistent with good clinical practice. For example, a few physicians indicated that they considered pneumonia as ruled out despite a high probability of pneumonia. Similarly, for the influenza scenario, several physicians indicated that they considered influenza ruled out despite a high probability. One explanation is that this represents the decisions they would make if faced with a real patient who had this probability of disease. Another possibility is that the physicians misunderstood the question or mistakenly selected an option due to unfamiliarity with web browsers or computer-based quizzes. This seems unlikely, as the average age of the physicians making the decisions described above was similar to that of the overall group (52 vs 51 years).
Finally, physician beliefs about the appropriateness of ever ordering a diagnostic test or ever prescribing a drug may have influenced responses in the influenza scenario. Four of 78 Swiss physicians considered influenza ruled out despite probabilities of 50% or higher, perhaps reflecting a lack of satisfaction with the alternatives presented in the scenario (order a rapid test or initiate treatment for influenza). Clearly, the wording of the scenario must be carefully crafted to be clear and simple, yet reflect realistic management strategies for most physicians and may need to be individualised to a country or health system.
In conclusion, we found that it is possible to determine decision thresholds based on simple web-based scenarios, but the ability to do so may depend on the wording of the clinical vignette. These thresholds can be used to identify clinically sensible cut-offs for risk groups by those developing clinical decision rules for conditions such as ACS, pneumonia and DVT; however, this warrants further research. We also identified differences in decision-making between US and Swiss physicians possibly due to a different medical context and culture. This is important, as it questions the appropriateness of universal clinical recommendations for the management of common diseases.
Acknowledgments
The authors would like to thank the physicians who took the time to complete our survey, in particular the members of the Swiss Sentinella Network.
References
Supplementary materials
Supplementary Data
This web only file has been produced by the BMJ Publishing Group from an electronic file supplied by the author(s) and has not been edited for content.
Files in this Data Supplement:
- Data supplement 1 - Online appendix A
- Data supplement 2 - Online appendix B
- Data supplement 3 - Online appendix C
Footnotes
Funding NS is supported by an academic scholarship ‘bridge-relève’ provided by the Leenaards Foundation.
Competing interests None.
Ethics approval University of Georgia Human Subjects Committee.
Provenance and peer review Not commissioned; externally peer reviewed.
Linked Articles
- Correction