Article Text

Abstract
Background: Nosocomial infections occur in approximately 10% of patients in intensive care units (ICUs). Several studies have shown that a quality improvement initiative can reduce nosocomial infections, mortality, and cost.
Context: Our hospital is located in Northern Mississippi and has a 28 bed Medical-Surgical ICU unit with 95% occupancy. We joined the ICU collaborative with the IMPACT initiative of the Institute of Healthcare Improvement (IHI) in October 2002. A preliminary prospective before (fiscal year (FY) 2001–2) and after (FY 2003) hypothesis generating study was conducted of outcomes resulting from small tests of change in the management of ICU patients.
Key measures for improvement: Nosocomial infection rates, adverse events per ICU day, average length of stay, and average cost per ICU episode.
Strategy for change: Four changes were implemented: (1) physician led multidisciplinary rounds; (2) daily “flow” meeting to assess bed availability; (3) “bundles” (sets of evidence based best practices); and (4) culture changes with a focus on the team decision making process.
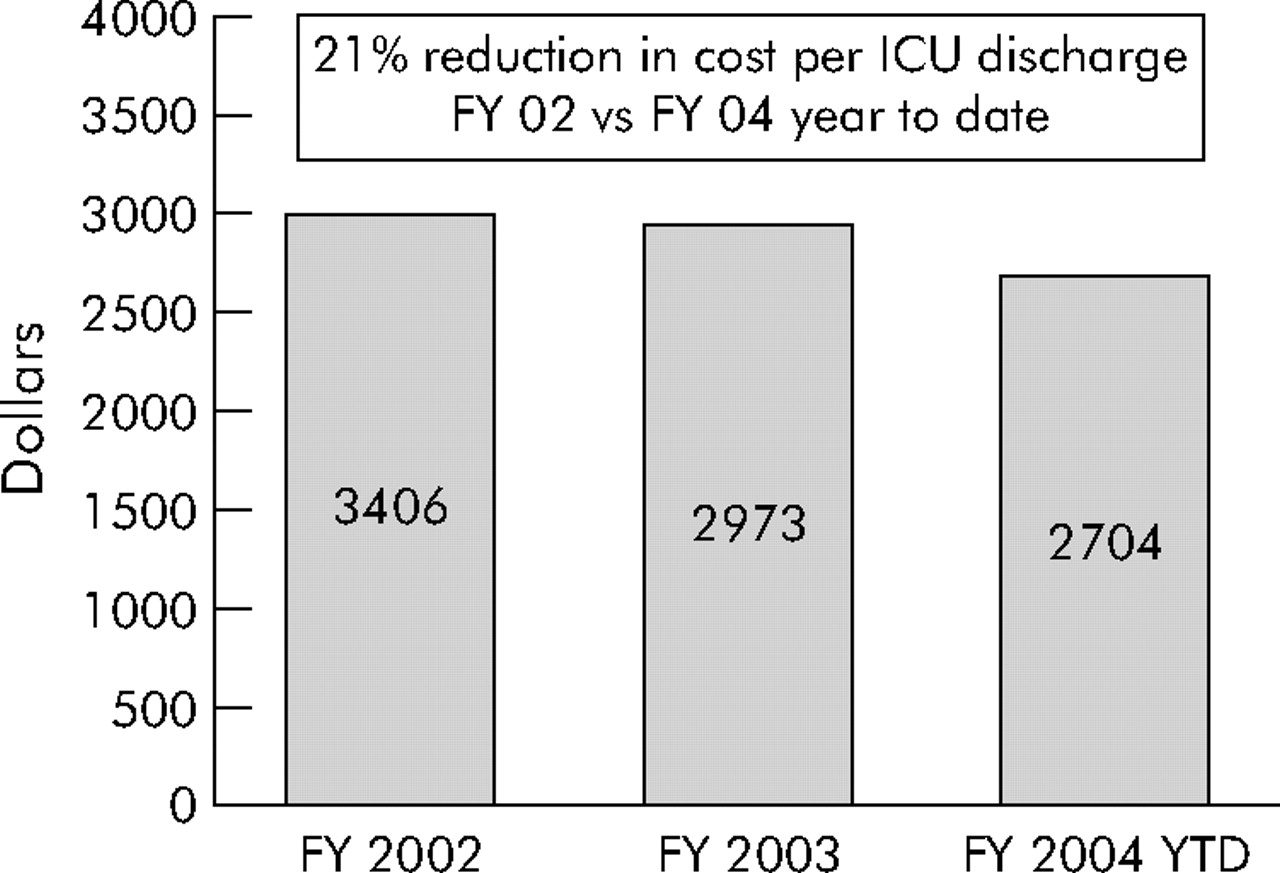
Effects of change: Between baseline and re-measurement periods, nosocomial infection rates declined for ventilator associated pneumonia (from 7.5 to 3.2 per 1000 ventilator days, p = 0.04) and bloodstream infections (from 5.9 to 3.1 per 1000 line days, p = 0.03), with a downward trend in the rate of urinary tract infections (from 3.8 to 2.4 per 1000 catheter days, p = 0.17). There was a strong downward trend in the rates of adverse events in the ICU as well as the average length of stay per episode. From FY 2002 to FY 2003 the cost per ICU episode fell from $3406 to $2973.
Lessons learned: A systematic approach through collaboration with IHI’s IMPACT initiative may have contributed to significant improvements in care in the ICU setting. Multidisciplinary teams appeared to improve communication, and bundles provided consistency of evidence based practices. The flow meetings allowed for rapid prioritization of activity and a new decision making culture empowered team members. The impact of these changes needs to be assessed more widely using rigorous study designs.
- BSI, bloodstream infections
- DNR, do not resuscitate
- ICU, intensive care unit
- MRSA, methicillin resistant Staphylococcus aureus
- UTI, urinary tract infection
- VAP, ventilator associated pneumonia
- VRE, vancomycin resistant Enterococcus
- intensive care
- nosocomial infections
- bundles
- quality improvement
Statistics from Altmetric.com
- BSI, bloodstream infections
- DNR, do not resuscitate
- ICU, intensive care unit
- MRSA, methicillin resistant Staphylococcus aureus
- UTI, urinary tract infection
- VAP, ventilator associated pneumonia
- VRE, vancomycin resistant Enterococcus
- intensive care
- nosocomial infections
- bundles
- quality improvement
Over five million people are admitted to intensive care units (ICUs) each year in the United States, of whom 500 000 (10%) die.1 Nosocomial infections occur in approximately 10% of the ICU patients at the rate of 21–25 infections per 1000 ICU patient-days.2,3 Devices are a major cause of nosocomial infections. Urinary tract infections (UTI) account for 31% of the infections, of which 95% are associated with urinary catheters. Pneumonia accounts for 27% of nosocomial infections, of which 86% are associated with mechanical ventilation. Primary bloodstream infection (BSI) accounts for 19% of nosocomial infections, of which 87% are associated with central lines.4
Several studies show that quality improvement initiatives can reduce nosocomial infections, mortality, and cost.5–7 Raising the head of the bed to 30 degrees8 and providing peptic ulcer disease and deep venous thrombosis prophylaxis can reduce infection and complication rates and decrease mortality.1 These processes, together with intermittent sedation, have been defined as a ventilator bundle.9 Multidisciplinary rounds and a team approach to the management of critically ill patients have been shown to improve outcomes.10
CONTEXT
In October 2002 we started an ICU quality improvement project in collaboration with the “IMPACT” initiative of the Institute of Healthcare Improvement (IHI) (http://www.ihi.org/IHI/Programs/IMPACTNetwork/IMPACTNetwork.htm). IMPACT is a membership network composed of over 200 organizations and individuals working collectively to improve health care under the expertise and guidance of the IHI.
At the meeting the ICU Nurse Manager, the Quality Improvement Director, and administrative leaders developed a project worksheet with qualitative and quantitative goals. The qualitative aims were: (1) to promote a culture of healing, (2) to promote teamwork, and (3) to achieve optimal clinical, spiritual, and financial outcomes for patients. The quantitative aims were: (1) to reduce the adverse events per ICU day by 50% (baseline 24 events, goal<12), (2) to reduce the rate of ventilator associated pneumonia (VAP) by 25% (baseline rate of 7.5 per 1000 ventilator-days to goal rate of 5.5), and (3) to reduce device related BSI by 44% (baseline rate of 5.9 per 1000 line-days to goal rate of 3.3).
The study was performed at Baptist DeSoto Hospital in Southaven, Mississippi from 1 October 2000 to 30 September 2002 (fiscal year 2001 and 2002) as the baseline period and from 1 October 2002 to 30 September 2003 (fiscal year 2003) as the intervention period. The ICU at DeSoto Hospital is a 28 bed unit with 20 ICU and eight step down beds. The average occupancy rate of the ICU is 95%. The nurse to patient ratio in the ICU is one to two.
KEY MEASURES FOR IMPROVEMENT
The indicators measured were adverse events per ICU day, VAP rate, BSI rate, and nosocomial UTI rate. The definition of each of these indicators was the standard CDC definition (http://www.apic.org/pdf/cdcdefs.pdf). Mortality was defined as the number of ICU deaths per ICU discharges per month and was abstracted from clinical records using discharge disposition codes. The length of stay and financial indicators were defined as follows. The rolling 12 month average length of stay per episode was based on the average length of each episode of ICU care and abstracted using the patient information system disposition data. The cost per work load unit (patient day) was defined as total cost for caring for a patient in the ICU for one 24 hour period or patient day and abstracted using McKesson software (http://www.mckesson.com/homeflash.html). The cost per ICU episode was defined as cost per workload unit × average length of stay.
The χ2 statistic was used to compare the number of infections during baseline with the number of infections during the re-measurement time periods. For example, the total number of VAP cases per ventilator day for the combined baseline plus re-measurement time periods was taken as the expected rate under the null hypothesis that the infection rate was independent of the time period. Under this null hypothesis the expected infections during each specific time period were then determined from this total rate of VAPs per ventilator day and the specific number of ventilator days in each period. The χ2 statistic is the sum across time periods of squared differences between the observed and expected infections per expected infections. The rates of resistant organisms, methicillin resistant Staphylococcus aureus (MRSA), and vancomycin resistant Enterococcus (VRE) were tracked in the ICU.
An infection control nurse abstracted data for the nosocomial indicators—specifically VAP, BSI, and UTI. A registered nurse abstracted data for adverse events by doing a random review of at least 20 charts of ICU patients per month, which represented a 20% sampling. The data abstractors were not blinded to the study period. Financial and length of stay data were obtained from the administrative software. Trigger tools were used to define and measure adverse events. Trigger tools are events that initiated a drill down exercise to search for root causes. Although most of the triggers did not allow for prevention or intervention on the specific patient on whom the adverse event occurred, they did help in averting future adverse events. A list of the trigger tools used is shown in box 1.
Box 1 Trigger tools used to define adverse events in the ICU11
-
Transfusion or use of blood products
-
Any code or arrest
-
Dialysis
-
Positive blood culture
-
Radiograph or Doppler scan for emboli
-
Abrupt drop of >25% in hemoglobin or hematocrit
-
Patient fall
-
Decubiti
-
Readmission within 30 days
-
Restraint use
-
Infection of any kind
-
In-hospital stroke
-
Transfer to higher level of care
-
C difficile positive
-
Prothrombin time (PTT) >100 seconds
-
INR >6
-
Glucose <50 mg/dl
-
Rising BUN/serum creatine >2 × base
-
Vitamin K administration
-
Benadryl (diphenhydramine) use
-
Romazicon (flumazenil) use
-
Narcan (naloxone) use
-
Antiemetic use
-
Oversedation/hypotension
-
Abrupt medication stop
-
Pneumonia onset
-
Readmission to ICU
-
In unit procedure
-
Intubation/reintubation
STRATEGY FOR CHANGE
The study involved four critical changes in care systems:
-
Physician led multidisciplinary rounds.
-
Daily bed flow meetings.
-
Bundles.
-
Culture change.
Physician led multidisciplinary rounds
Before the collaborative the patient care model in the ICU was primary nursing. The patients’ nurses were responsible for the comprehensive care of their two assigned patients. Ancillary services were available as needed but did not actively seek out opportunities to intervene. Physician led rounds were initiated in the ICU in October 2002. Intensivists contracted by the hospital rounded with a multidisciplinary team starting in October 2002 and were present in the hospital for 8 hours/day. The team consisted of the patient’s nurse, ICU charge nurse, pharmacist, dietician, respiratory therapist, case manager, social worker, physical therapist, and palliative care nurse. The team set daily goals and used “trigger tools”.11
Daily bed flow meetings
“Bed flow” refers to transfer of patients within the facility to different levels of care based on their clinical condition and availability of beds. Before October 2002 the administrative house supervisor was held accountable for bed flow throughout the facility. This activity consumed about 80% of her time. A change was made to have 20 minute multidisciplinary meetings at 9 am and 4 pm seven days per week to assess facility status, prioritize interventions, review historical data, and set goals for the day. The meeting was led by the administrative house supervisor and included case management, social services, environmental services, nursing representatives from all units, and admissions. Historical utilization data were used as part of the goal setting process. For example, we regularly admit 20% of our emergency department volume. Emergency department volume averages 100 visits per day. Therefore, we knew at 9 am that we would probably need at least 20 beds for emergency department admissions. We were able to do similar calculations with scheduling information from the catheterization laboratory and the ICU. Our goal at 9 am was the facilitation of the flow process to make these beds available by 4 pm. At 4 pm we assessed our progress and made plans for the next day. The house supervisor facilitated the bed flow meetings, but it became a multidisciplinary process and was no longer her sole responsibility.
Bundles
At baseline, nursing interventions were defined in policies and procedures. Physician preferences were typically called protocols. Neither could be changed, updated, or refined in an expedited manner. After October 2002 we used a bundles approach. Bundles are sets of evidence based best practices designed to optimize treatment and prevent complications.12 The use of bundles complemented our multidisciplinary rounds by reviewing the bundle checklist during rounds. Bundles for VAP, central lines, UTI, and other initiatives were implemented. The definition of bundles at our hospital varied somewhat from other definitions in the literature due to input from local team members. The guidelines for the bundles were derived from the literature, Centers for Disease Control (CDC) recommendations, and local staff recommendations.12–16 The bundles used in our intervention are shown in box 2.
Box 2 Bundles implemented for each of the quality initiatives12–16
Ventilator bundle
-
Elevate the head of the bed to 30 degrees.
-
Peptic ulcer disease prophylaxis.
-
Deep venous thrombosis prophylaxis.
-
Mouth care every 2 hours.
-
Sedation vacation every 24 hours.
-
Repeated ready-to-wean evaluations.
Central line bundle
-
Standard hand disinfection before procedure.
-
Mask, sterile gown, sterile gloves, and cap for all procedures.
-
Site preparation with chorohexidine stick.
-
Full sterile drape.
-
Dress site with kit, biopatch, and medicated disc.
UTI bundle
-
Regular assessment of continued need for catheter.
-
Sterile technique at insertion.
-
Perineal care daily and after bowel movement.
-
Drainage bag lower than patient’s bladder at all times, including during transport.
-
Secure all catheters.
-
Use silver coated catheter in selected cases.
Culture change
We encouraged a decision making process which welcomed input from every multidisciplinary team member. The intensivists led the rounds, but everyone’s opinion was heard. There was administrative support and physician buy-in towards the team approach. However, we did not measure culture change.
EFFECTS OF CHANGE
The device utilization rates, infection rates, mortality, Medicare case mix index, MRSA rates and VRE rates are presented in table 1. Figure 1 shows the rate of nosocomial infection over 3 years with National Nosocomial Infection Surveillance (NNIS) comparisons.17 Figure 2 is an annotated run chart of adverse events in the ICU per day.
Device days and infection rates for fiscal years 2001–3
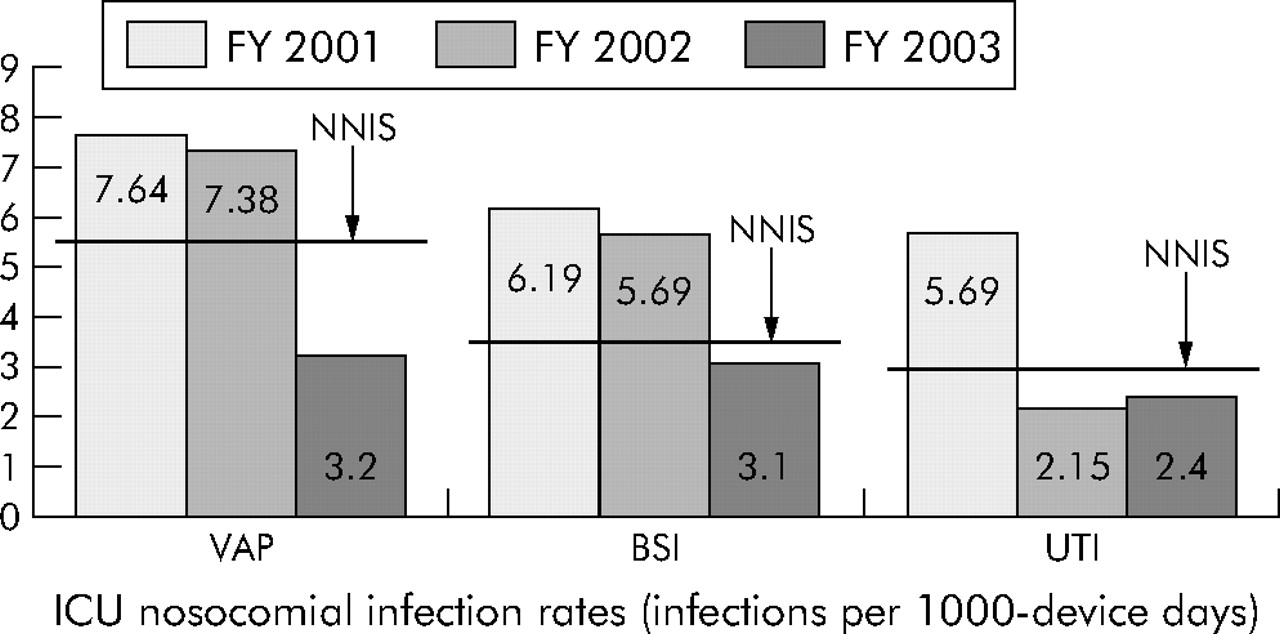
Reduction in adverse events in the ICU in relation to onset of specific quality improvement interventions with National Nosocomial Infection Surveillance (NNNIS) comparisons.17 VAP, ventilator associated infection; BSI, bloodstream infection; UTI, urinary tract infection.

Run chart of number of adverse events in the ICU (adverse events defined in box 1).11
We were able to show a significant improvement in selected indicators and a reduction in the cost and length of stay coincident with this quality improvement effort. Our VAP rate per 1000 procedure days declined from 7.4 in the baseline period (fiscal years 2001 and 2002) to 3.2 in the intervention period (fiscal year 2003). Other studies experienced a VAP rate in the range of 7.7–11.9 from 1995 to 20005 and, when compared with non-teaching medical-surgical ICUs in the NNIS data, our hospital moved up from the 75th percentile to the 25th percentile in just 1 year. The decline in the VAP rate was concurrent with, and may in part be explained by, the decline in the average ventilator time in the ICU which decreased from 62 hours in October 2002 to 41.4 hours in September 2003. The semi-recumbent position has also been shown to be a key prevention strategy for VAP.18
The consistent use of maximum barrier precautions as well as chlorhexidine skin preparation was put in place with our central line bundle protocol. Raad and colleagues19 have shown that maximum barriers lead to a decline in infection rates and Maki et al20 have shown that chlorhexidine skin preparations also prevent infections. Our BSI rates per 1000 line-days declined from 5.9 at baseline to 3.1 in the re-measurement period.
A decline in UTI was noted from 2001 to 2002 and was maintained between 2002 and 2003. This decline began before intervention of the UTI bundles; however, once the bundles were in place, we experienced four successive months without a single nosocomial UTI in our ICU. Two critical elements in reducing catheter associated UTI are to keep the catheter system closed and to remove the catheter as soon as possible.21 Both of these strategies were part of our UTI bundles.
A decline in the rate of adverse events was seen after the onset of multidisciplinary team rounds. The run chart (fig 2) strongly suggests that these rounds were the most important single intervention, but this may have been due to a Hawthorne effect. Unfortunately, only 3 months of 2002 or 60 charts were used to define the baseline adverse event rates before the intervention in 2003. The precipitous decline over the first 2 months of the intervention is reflected by sampling of 120 charts. Our success with the trigger tool methodology is not isolated; other studies have shown that the trigger tool is an effective strategy for identifying adverse events (http://www.qualityhealthcare.org/IHI/Topics/PatientSafety/MedicationSystems/ImprovementStories/).
We experienced no decline in the mortality rate from 2002 to 2003, even with improvement in the VAP rate which may cause the greatest attributable morbidity and mortality among the complications we targeted.22 There may be several reasons for this. Our hospital case mix index rose slightly during this time, although we do not have data on our ICU case mix index. Also, our definition of mortality was problematic. It included all patients in the ICU, even those whose status was “do not resuscitate” (DNR). A decline in mortality due to VAP, BSI, or UTI may therefore have been obscured by an increase in deaths among patients with a DNR status. On the other hand, patients who were likely to die may have been moved out of the ICU and not accounted for in the ICU mortality data.
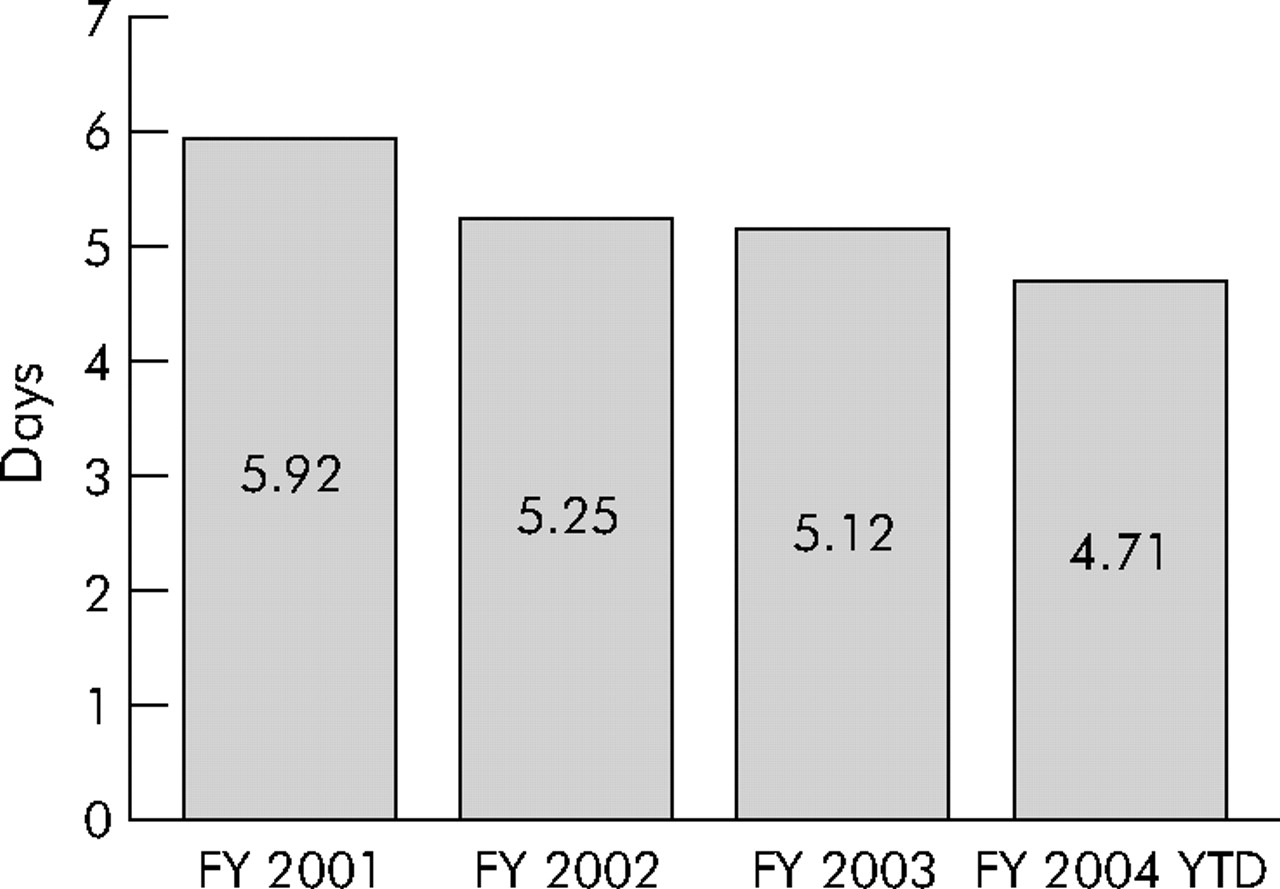
Figures 3 and 4 show the average length of stay and financial data over the baseline and intervention periods. Administrative data collected independently of our abstraction validated our improvement efforts. The length of stay in the ICU declined, as did the cost per patient workload. The trend of average length of stay reached below 2.5 days by September 2003. The cost per ICU episode decreased by 21% from 2002 to 2003, and further declines were noted in the first half of 2004. Although these trends may not continue, they validate assertions that a 20–30% reduction in cost can be achieved even while improving quality—or perhaps resulting from quality improvements—in intensive care units.

Rolling average of length of stay per stay in the ICU. FY, fiscal year.
Average cost per ICU episode over 2.5 years with fiscal year (FY) 2004 data to 1 March 2004.
LESSONS LEARNED
Adverse events and nosocomial infections declined following the introduction of a changed system of care in the ICU that included at least four components: multidisciplinary teams; use of bundles; use of flow meetings; and change in culture. Unfortunately, we cannot surmise which of the four elements contributed to the change and whether any subset of them alone would have sufficed.
Multidisciplinary teams were the first and, we believe, the most critical change put into practice. The team approach led to improved communications among physicians, nurses, respiratory therapists, pharmacist, dieticians, and others. Better communication provided ongoing interdisciplinary education of all team members, and it supported better coordination of care for patients and concurrent data feedback.
The “bundles” approach facilitated the active implementation of evidence based medicine. The bundles provided for completeness, consistency, and application of evidence based medicine interventions by acting as a reminder system.
Flow meetings allowed for timely decisions and prioritization of activity. For the nurse managers, such meetings were critical because the decisions made were based on latest information and proactively rather than reactively.
Although we did not objectively measure the change in culture, we believe a change in culture was occurring. This change empowered the team members and placed the responsibility on the team rather than on the physician, the patient’s nurse, the nurse manager, or the infection control nurse individually. The penalty-free culture allowed team members to share new and innovative ideas which would have been suppressed in a vertical environment. Physician buy-in—which is often difficult to obtain yet critical for success—was increased by providing data feedback to physicians, by providing reimbursements to intensivists for ICU rounds, and by employing care bundles to ease the burden of responsibility for routine orders. Although the attitudes of intensivists were not directly measured in this study, they did report that one net result of the ICU intervention was to decrease interruptive pages to them (Dr William Richards, personal communication, February 2004).
Our study had several limitations. The “before and after” study design may have been vulnerable to unmeasured confounding factors. Specifically, during 2003 the hospital’s administration and nursing made a strong push on quality improvement initiatives. Secondly, the Hawthorne effect (a closer observation and measurement of infection rates) could have led to improvement. Thirdly, the abstractors of the nosocomial data were involved in the quality improvement effort and this may have introduced bias into the data collection. However, data sets collected by individuals not involved with quality improvement efforts showed findings consistent with clinical data. Lastly, a high degree of motivation and vigilance that was stimulated among team leaders at the start of the initiative may have been transient.
The real test will be to see if the gains can be sustained over the next several years and whether, ultimately, there will be an effect on mortality. The effects of these interventions also need to be studied repeatedly in many settings, and the contributions of the various change components assessed using rigorous study designs such as phased introduction of individual components.
Acknowledgments
The authors thank Bill Richards MD, DeSoto Nursing and Administration, Roger VanderZwaag and, at the Institute for Healthcare Improvement, Jane Roessner, Val Weber, and Frank Davidoff.
REFERENCES
Footnotes
-
Funding: none.
-
Competing interests: none declared.