
Article Figures & Data
Figures
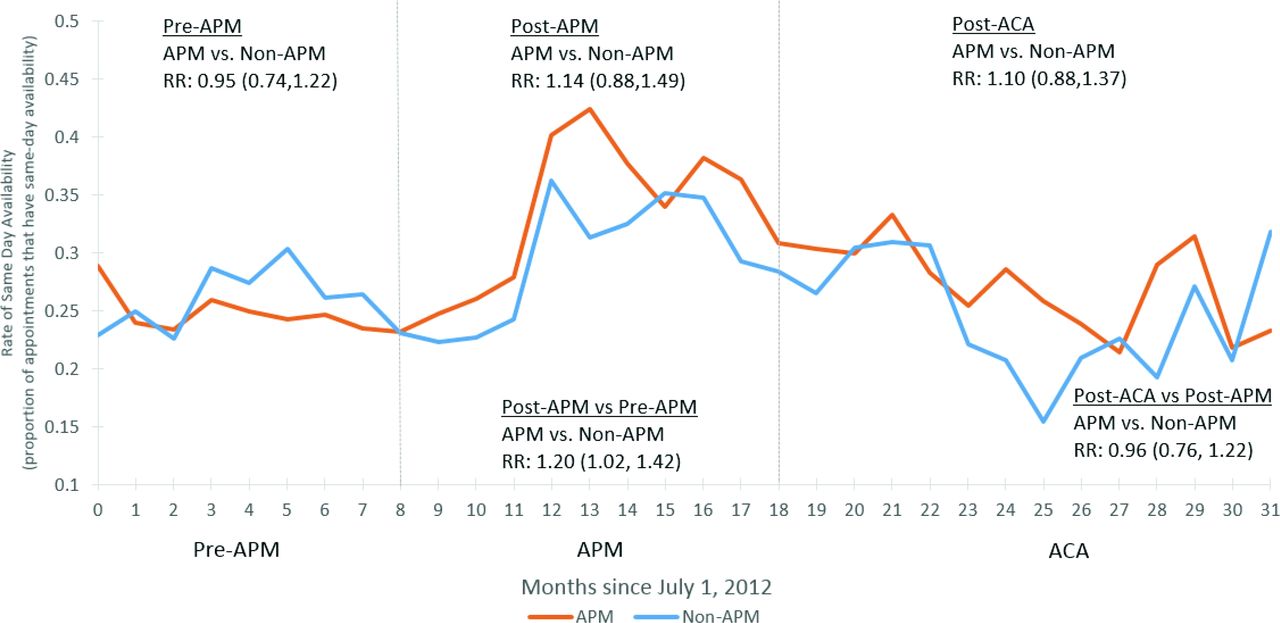
- Figure 1.
Same day availability changes and relative rates in APM and non-APM comparison clinics before and after the APM and ACA implementations. APM: Alternative Payment Methodology; ACA, Affordable Care Act; RR, Relative Rates.

Tables
- Table 1.
Comparison of Clinic Characteristics Between APM Clinics and Non-APM clinics, prior to APM implementation (July 1, 2012 to February 28, 2013)
Characteristic APM Clinics (n = 8) Non-APM Clinics (n = 10) Mean (SD) panel size 5,322.25 (2358.40) 2,874.00 (777.57) % High Needs* 39.35 (6.95) 34.54 (6.13) Mean (SD) number of medical doctors/doctors of osteopathy per 1000 patients 4.98 (3.49) 4.97 (3.22) Mean (SD) number of advanced practice providers per 1000 patients 3.35 (1.6) 6.26 (4.33) % Rural 0% 10% Mean (SD) office visits/patient 2.89 (2.95) 2.85 (3.04) Mean (SD) non-provider encounters/patient 5.55 (7.08) 5.23 (6.54) Mean (SD) % Hispanic patients 40.43 (26.05) 21.25 (11.46) Mean (SD) % Spanish speaking patients 31.83 (24.1) 13.35 (8.95) Mean (SD) % patients with Medicaid 46.89 (7.12) 41.37 (13.52) Mean (SD) % Uninsured patients 35.18 (10.29) 35.92 (8.6) APM, Alternative Payment Methodology; SD, standard deviation.
↵* High needs patients are defined as patients who are between the age of 2 and 5 years, or those who are female and between the age of 18 and 44 years.
- Table 2.
Total Visit Rates, New Patient Visit Rates, and Total Alternative Encounters Over Study Time Periods (Pre-APM, Pre-ACA; Post-APM, Pre-ACA; Post-APM Post-ACA)
Outcome Encounters/1000 Patients per Month* Relative Rates Pre-APM Post-APM Post-ACA Post-APM vs Pre-APM Post-ACA vs Post-APM Total encounters† APM clinics 651.02 672.82 716.07 1.03 (0.98, 1.09) 1.06 (0.98, 1.15) Non-APM comparison clinics 435.10 463.21 480.33 1.07 (0.99, 1.13) 1.04 (0.96, 1.12) APM vs Non-APM comparison relative rate 0.97 (0.89, 1.05) 1.03 (0.92, 1.15) New patient visits‡ APM clinics 6.52 5.47 7.30 0.84 (0.60, 1.16) 1.34 (0.86, 2.08) Non-APM comparison clinics 4.94 5.12 5.35 1.04 (0.80, 1.35) 1.04 (0.72, 1.52) APM vs Non-APM comparison relative rate 0.81 (0.53, 1.23) 1.28 (0.71, 2.29) Alternative encounters‡ APM clinics 801.53 872.66 950.09 1.09 (1.04, 1.14) 1.09 (0.99, 1.19) Non-APM comparison clinics 657.28 723.15 769.75 1.10 (1.04, 1.17) 1.06 (0.98, 1.16) APM vs Non-APM comparison relative rate 0.99 (0.92, 1.07) 1.02 (0.90, 1.16) ACA, Affordable Care Act; APM, alternative payment methodology.
Total alternative encounters included hospice visits, home health visits, nurse visits, telemedicine, telephone and email consultations, lab- and imaging-only visits, and visits with a pharmacist.
↵* Rates were determined from Poisson regression models of APM status × month, utilizing a robust sandwich estimator to account for correlations within clinics and were adjusted for percent Hispanic, percent Medicaid insurance and percent of panel in a high needs age group.
↵† There was a positive trend in outcome within the pre-period in both APM and Comparison groups; differences in pre-period trend were not statistically significant.
↵‡ There were no statistically significant trends in outcomes during the pre-period.
- Table 3.
Scheduling Metrics: Appointment Availability, Overbooks, and No-Shows/Late Cancellations Over Study Time Periods (Pre-APM, Pre-ACA; Post-APM, Pre-ACA; Post-APM Post-ACA)
Outcome Pre-APM Post-APM Post-ACA Relative Rates Post-APM vs Pre-APM Post-ACA vs Post-APM Proportion of appointment searches indicating same day availability* APM clinics 0.25 0.33 0.27 1.33 (1.21,1.48) 0.82 (0.71,0.94) Non-APM comparison clinics 0.26 0.29 0.25 1.11 (0.97, 1.27) 0.85 (0.70,1.03) APM vs Non-APM comparison relative ratio 1.20 (1.02, 1.42) 0.96 (0.76, 1.22) Mean days to 3rd next available appointment† APM clinics 2.96 2.24 2.87 −0.72 (−1.34, −0.11) 0.63 (0.27, 0.99) Non-APM comparison clinics 3.96 4.23 4.66 0.27 (−0.51, 1.05) 0.43 (−1.07, 1.93) APM vs non-APM comparison difference in means −0.99 (−1.99, 0) 0.21 (−1.33, 1.75) Overbooks per month/per 100 appointment slots APM clinics 5.29 5.55 5.83 1.05 (0.81, 1.36) 1.05 (0.8, 1.37) Non-APM comparison clinics 5.96 6.59 5.90 1.11 (0.83, 1.47) 0.90 (0.72, 1.12) APM vs non-APM comparison relative rate 0.95 (0.65, 1.39) 1.17 (0.83, 1.66) No-shows/late cancellation per month per 100 appointment slots* APM clinics 7.04 6.69 6.57 0.95 (0.84, 1.07) 0.98 (0.93, 1.04) Non-APM comparison clinics 5.80 5.68 5.70 0.98 (0.87, 1.1) 1.00 (0.95, 1.06) APM vs non-APM comparison relative rate 0.97 (0.82, 1.15) 0.98 (0.91, 1.06) APM, Alternative Payment Methodology; ACA, Affordable Care Act.
↵* Proportions were determined from logistic regression models of APM status × month, utilizing a robust sandwich estimator to account for correlations within clinics and were adjusted for percent Hispanic, percent Medicaid insurance and percent of panel in a high needs age group. There were no significant trends in proportion within the pre-period.
↵† Rates were determined from Poisson regression models of APM status × month, utilizing a robust sandwich estimator to account for correlations within clinics and were adjusted for percent Hispanic, percent Medicaid insurance and percent of panel in a high needs age group. There were no significant trends in rates within the pre-period.
‡ There was a positive trend in outcome within the pre-period in APM clinic and a downward trends within the pre-period in comparison clinics.
- Appendix Table 1.
Total Visit Rates, New-Patient Visit Rates, and Total Alternative Encounters Over Study Time Periods (Pre-APM, Pre-ACA; Post-APM, Pre-ACA; Post-APM Post-ACA)
Outcome Encounters/1000 Patients Per Month* Relative Rates Pre-APM Post-APM Post-ACA Post-APM vs Pre-APM Post-ACA vs Post-APM Total encounters† APM clinics 651.02 (550.57, 769.79) 672.82 (544.77, 830.98) 716.07 (565.29, 907.07) 1.03 (0.98, 1.09) 1.06 (0.98, 1.15) Non-APM comparison clinics 435.10 (371.15, 510.07) 463.21 (409.76, 523.62) 480.33 (427.15, 540.12) 1.07 (0.99, 1.13) 1.04 (0.96, 1.12) APM vs non-APM comparison relative rate 1.50 (1.17, 1.92) 1.45 (1.11, 1.90) 1.49 (1.12, 1.99) 0.97 (0.89, 1.05) 1.03 (0.92, 1.15) New patient visits‡ APM clinics 6.52 (4.68, 9.10) 5.47 (3.94, 7.60) 7.30 (5.75, 9.27) 0.84 (0.60, 1.16) 1.34 (0.86, 2.08) Non-APM comparison clinics 4.94 (3.84, 6.36) 5.12 (3.55, 7.40) 5.35 (3.71, 7.72) 1.04 (0.80, 1.35) 1.04 (0.72, 1.52) APM vs non-APM comparison relative rate 1.32 (0.87, 2.01) 1.07 (0.64, 1.77) 1.36 (0.88, 2.11) 0.81 (0.53, 1.23) 1.28 (0.71, 2.29) Alternative encounters‡ APM clinics 801.53 (707.54, 908.01) 872.66 (748.41, 1017.53) 950.09 (779.62,1157.82) 1.09 (1.04, 1.14) 1.09 (0.99, 1.19) Non-APM comparison clinics 657.28 (585.48, 737.88) 723.15 (642.99, 813.30) 769.75 (662.70, 894.10) 1.10 (1.04, 1.17) 1.06 (0.98, 1.16) APM vs Non-APM comparison relative rate 1.22 (1.02, 1.46) 1.21 (0.98, 1.48) 1.23 (0.96, 1.59) 0.99 (0.92, 1.07) 1.02 (0.90, 1.16) ACA, Affordable Care Act; APM, Alternative Payment Methodology.
Total alternative encounters included hospice visits, home health visits, nurse visits, telemedicine, telephone and email consultations, lab and imaging only visits, and visits with a pharmacist.
↵* Rates were determined from Poisson regression models of APM status*month, utilizing a robust sandwich estimator to account for correlations within clinics and were adjusted for percent Hispanic, percent Medicaid insurance and percent of panel in a high needs age group.
↵† There was a positive trend in outcome within the pre-period in both APM and Comparison groups; differences in pre-period trend were not statistically significant.
↵‡ There were no statistically significant trends in outcomes during the pre-period.
- Appendix Table 2.
Scheduling Metrics: Appointment Availability, Overbooks, and No-Shows/Late Cancellations Over Study Time Periods (Pre-APM, Pre-ACA; Post-APM, Pre-ACA; Post-APM Post-ACA)
Outcome Pre-APM Post-APM Post-ACA Relative Rates/Difference in Difference Post-APM vs Pre-APM Post-ACA vs Post-APM Proportion of appointment searches indicating same day availability* APM clinics 0.25 (0.20, 0.31) 0.33 (0.29,0.39) 0.27 (0.24,0.31) 1.33 (1.21,1.48) 0.82 (0.71,0.94) Non-APM comparison clinics 0.26 (0.23,0.30) 0.29 (0.24,0.36) 0.25 (0.22,0.29) 1.11 (0.97, 1.27) 0.85 (0.70,1.03) APM vs non-APM Comparison 0.95 1.14 1.10 1.20 0.96 Relative ratio (0.74,1.22) (0.88,1.49) (0.88,1.37) (1.02, 1.42) (0.76, 1.22) Mean days to 3rd next available appointment‡ APM clinics 2.96 (2.36, 3.55) 2.24 (1.61, 2.86) 2.87 (2.2, 3.53) −0.72 (−1.34, −0.11) 0.63 (0.27, 0.99) Non-APM comparison clinics 3.96 (2.86, 5.07) 4.23 (3.05, 5.41) 4.66 (3.12, 6.2) 0.27 (−0.51, 1.05) 0.43 (−1.07, 1.93) APM vs non-APM comparison difference in means −1.00 (−2.26, 0.25) −2.00 (−3.39, −0.61) −1.79 (−3.48, −0.1) − (−1.99, 0) 0.21 (−1.33, 1.75) Overbooks per month/per 100 appointment slots APM clinics 5.29 (4.43, 6.31) 5.55 (4.41, 6.99) 5.83 (4, 8.48) 1.05 (0.81, 1.36) 1.05 (0.8, 1.37) Non-APM comparison clinics 5.96 (4.13, 8.59) 6.59 (4.88, 8.89) 5.90 (4.17, 8.35) 1.11 (0.83, 1.47) 0.90 (0.72, 1.12) APM vs non-APM comparison relative rate 0.89 (0.6, 1.32) 0.84 (0.57, 1.25) 0.99 (0.58, 1.67) 0.95 (0.65, 1.39) 1.17 (0.83, 1.66) No-shows/late cancellation per month per 100 appointment slots*[1] APM clinics 7.04 (6.41, 7.73) 6.69 (6.27, 7.14) 6.57 (6.19, 6.97) 0.95 (0.84, 1.07) 0.98 (0.93, 1.04) Non-APM comparison clinics 5.80 (4.95, 6.8) 5.68 (5.19, 6.23) 5.70 (5.3, 6.13) 0.98 (0.87, 1.1) 1.00 (0.95, 1.06) APM vs non-APM comparison 1.21 1.18 1.15 0.97 0.98 Relative rate (1.03, 1.43) (1.06, 1.31) (1.06, 1.25) (0.82, 1.15) (0.91, 1.06) ACA, Affordable Care Act; APM, Alternative Payment Methodology.
↵* Proportions were determined from logistic regression models of APM status × month, utilizing a robust sandwich estimator to account for correlations within clinics and were adjusted for percent Hispanic, percent Medicaid insurance and percent of panel in a high-needs age group. There were no significant trends in proportion within the pre-period.
† Rates were determined from Poisson regression models of APM status × month, utilizing a robust sandwich estimator to account for correlations within clinics and were adjusted for percent Hispanic, percent Medicaid insurance and percent of panel in a high-needs age group. There were no significant trends in rates within the pre-period.
↵‡ There was a positive trend in outcome within the pre-period in APM clinic and a downward trends within the pre-period in comparison clinics.


