
Abstract
Background: Changing locations disrupts the populations served by primary health care clinics, and such changes may differentially affect access to care for vulnerable populations.
Methods: Online geographic information systems mapping tools were used to define how the relocation of a family medicine center impacted access to care for black and Hispanic patients with chronic disease.
Results: Maps created from practice management data revealed a distinct shift in black and Hispanic patients with chronic disease being served in the new location.
Conclusions: Geographic information systems tools are valuable aids in defining changing service areas of primary health care clinics.
Primary health care clinics are bound to the patients they serve by geography, an essential lesson rarely emphasized in preparing resident trainees for community practice.1 Policy makers promote access to a personal physician for all their constituents, and it is essential that providers understand their service areas and the impact of geography on those they serve. Residency clinics are the training ground for these skills but have traditionally lacked the tools necessary to demonstrate and contextualize caring for patients within the broader community.2
In 2003, hospital finances and politics forced the University of Cincinnati Family Medicine Residency Program (UCFP) to move its outpatient clinic (clinic A) to a new location 6.4 miles to the northeast (clinic B). Being one of the few primary care offices for vulnerable populations living near clinic A, faculty physicians were uncertain if the move would disrupt access to care and continuity for the black and Hispanic patients with the targeted chronic diseases, including diabetes, hypertension, and hyperlipidemia. UCFP physicians hoped to assess the spatial distribution of these vulnerable groups before and after the move but lacked the technical capacity, the knowledge of geographic information systems (GIS), and the funds to conduct spatial analyses. Working with the Robert Graham Center for Policy Studies, UCFP physicians tested whether a new online application intended to simplify the application of GIS for understanding privately held health data—HealthLandscape3—could document how disruptive the move was to the targeted subgroups served by the new office. HealthLandscape is an interactive web atlas that allows health professionals, policy makers, academic researchers and planners to combine, analyze and display information in ways that promote understanding and improvement of health and health care.
Methods
Clinical encounter data for all patients seen during a single year for the years 2002 (clinic A, 1 year before the move) and 2004 (clinic B, 1 year after the move) were extracted from practice management software. These records contained address, zip code, sex, race, and diagnoses from all visits in that year; these fields included data collected during the patient intake process. These records were uploaded using the secure, 128-bit, encrypted and Health Insurance Portability and Accountability Act-compliant “Health Center Mapping Tool” within HealthLandscape and were geocoded within the application, achieving 82% and 84% match rates for the years 2002 and 2004, respectively.4 Using tools within the site, investigators performed filtered queries of the data to display black or Hispanic patients diagnosed with the 3 indicator conditions mentioned above. These were turned into maps and were analyzed qualitatively to assess whether there were visible patterns consistent with a shift in vulnerable chronic disease patients over time.
Results
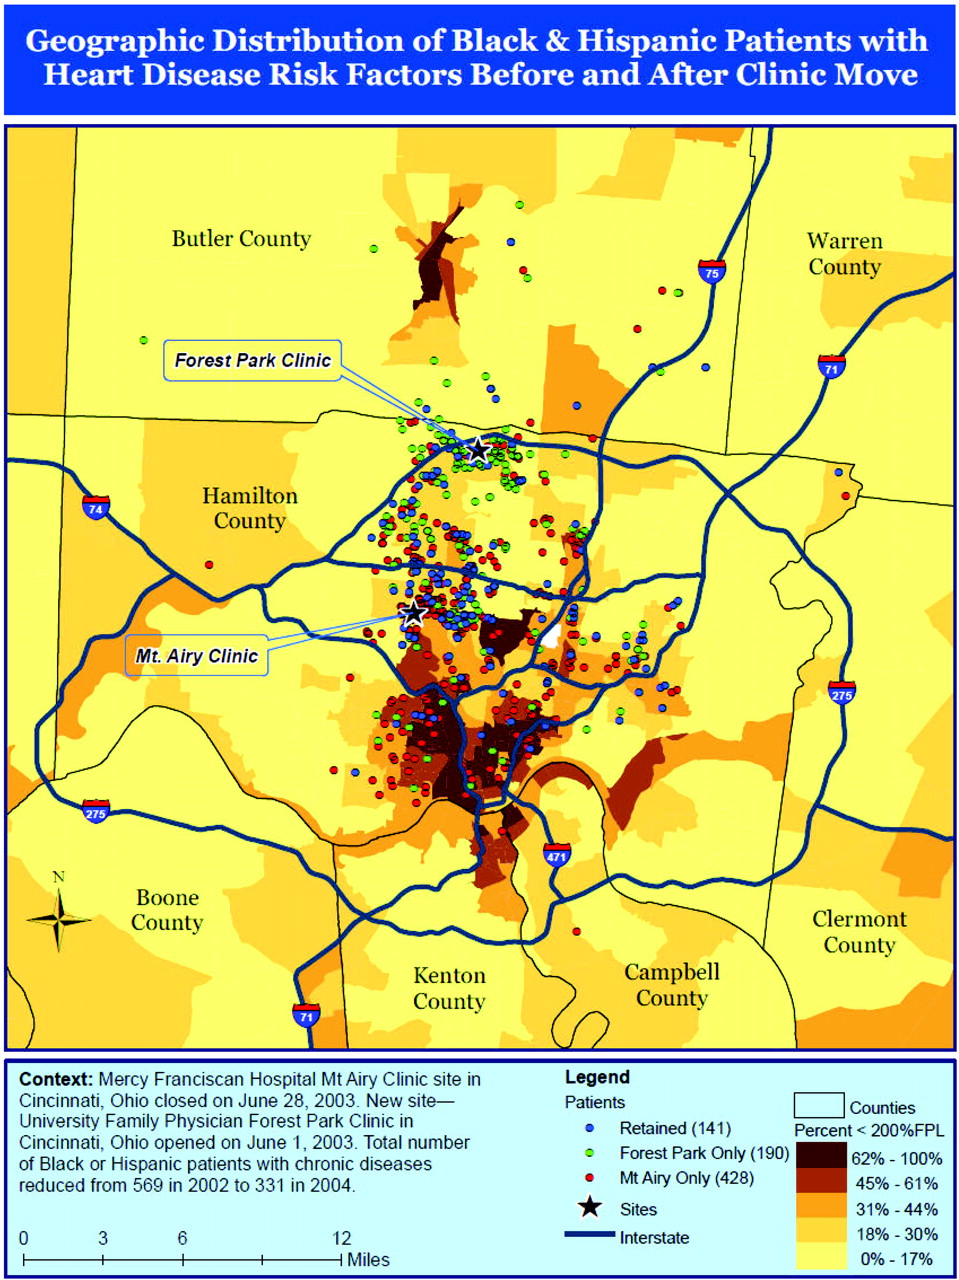
Using a series of maps (a sample of mapped data can be seen in Figure 1) displaying the targeted patient populations at varying extents, investigators were able to demonstrate a distinct shift between 2002 and 2004 in the source of Hispanic and African American patients with the targeted chronic conditions. Maps permitted clinic leaders to appreciate changes in targeted populations (black and Hispanic patients with diabetes, hypertension, or hyperlipidemia) served 1 year before and 1 year after a move to clinic B. Many such patients were from different neighborhoods than those that were served by clinic A.

Geographic distribution of black and Hispanic paitents with heart disease risk factors before and after the clinic move. Areas are shaded according to the proportion of households living below 200% of the Federal Poverty Limit within that census tract. Investigators noted a meaningful shift in the both the density and distribution of black and Hispanic patients with chronic disease who used the residency clinic away from poorer areas in Southwestern Cincinnati and toward more affluent areas in Northwestern Cincinnati. This was noteworthy because it was a sign that a group of vulnerable patients, with few other primary care options around clinic A, may be at risk of losing access to primary care because of the move.
Discussion
Using easily accessible data and a novel online GIS application, physicians from a family medicine graduate medical education program defined the deleterious impact of an unexpected clinic relocation on the utilization patterns of vulnerable patients. With the increasing accessibility to clinical and population data, physicians and medical directors across the country can use GIS to inform clinical operations, manage patient populations in a community context, and facilitate meeting the requirements for the teaching community medicine in family medicine.5 GIS may also serve as an advocacy tool in situations where uprooting or closing a residency training clinic is proposed by identifying the impact on the community and engendering community support.6
Acknowledgments
The authors thank Lisette Dunham for her help in manuscript preparation.
Notes
This article was externally peer reviewed.
Funding: none.
Conflict of interest: none declared.
- Received for publication May 4, 2009.
- Revision received August 27, 2009.
- Accepted for publication August 31, 2009.


