
Abstract
Background: Daily opioid therapy is widely used in the treatment of chronic noncancer pain, yet there is limited empirical evidence on the relationship of opioid dosing and health-related quality of life (HRQoL) in primary care settings.
Methods: An analysis was conducted to assess the relationship of opioid dose to quality of life. The sample consisted of 801 chronic pain patients who were prescribed daily opioids and 93 nonopioid users recruited from the practices of 235 primary care physicians. Eight HRQoL domain scores were calculated and compared with US norms and across opioid use groups. A new modeling technique, propensity score matching analysis, was performed to adjust for potential confounding factors across 4 morphine-equivalent opioid dose groups (<20 mg, 20–40 mg, 41–105 mg, >105 mg).
Results: HRQoL scores were significantly lower in chronic noncancer pain patients relative to the US general population regardless of opioid use. In unadjusted comparisons, those using up to 20 mg/d of opioids had the highest HRQoL scores, whereas those using >105 mg/d had the lowest. After adjusting for potential confounders, those in the 20 mg to 40 mg/d dosing group had significantly better HRQoL scores than their nonopioid-treated or higher dosed counterparts.
Conclusion: Use of low- to moderate-dose opioid therapy provides an improvement in HRQoL scores for chronic noncancer pain patients compared to no opioid therapy, while high-dose opioids have a smaller positive effect that is limited to mental health quality of life and patient satisfaction, and that may not justify treatment.
Opioid analgesics are being used more frequently in treating chronic noncancer pain (CNCP) patients. Despite continuing research and clinical experience, the effect of this therapy on health-related quality of life (HRQoL) remains a topic of debate.
Clinical trials offer some insight into the relationship between opioid use and HRQoL domains. A 2005 clinical studies review by Devulder and colleagues found that initiation of opioids was associated with improvement in pain and physical functioning in CNCP, but was linked to either no, or minimally positive, improvement in mental health.1 In a similar review, Kalso et al found a reduction in nociceptive and neuropathic pain in multiple randomized, placebo-controlled studies, but found little evidence of increase in physical activity or improvement in mood/markers of depression.2 In addition, a recent meta-analysis of clinical trials involving opioid therapy for CNCP found opioids were significantly more effective than alternate drugs or placebo for pain relief; for functional outcomes, however, other analgesics were superior.3
These results, though informative, cannot be considered a definitive answer to the question of the effect of opioids on HRQoL for CNCP patients.4 First, the results were pooled from a relatively small number of short-term studies, most of which focused on initiation of therapy. Second, the environment of a controlled trial may produce results that are not generalizable to general medical care settings. Many factors that confound the results of and serve as exclusionary criteria for these studies reflect the reality of treating CNCP patients with opioid analgesics. Finally, opioid dosing within clinical trials is frequently not flexible enough to accommodate individual needs, which may influence the measured relationship between treatment and quality of life.
The focus of this article was to explore the relationship between opioid use and HRQoL in CNCP patients being treated in primary care settings. The data used in this analysis was obtained from a cross-sectional survey of CNCP patients that assessed medication use, pain location, pain severity, demographic characteristics, substance use disorders, mental health, and quality of life. Eight hundred one patients using opioids on a regular basis were divided into 4 groups based on daily milligram morphine equivalent dose and compared with a control group of 93 subjects not currently taking opioids.
A propensity score matching analysis was used to adjust for a number of factors that could affect HRQoL scores in CNCP patients. Propensity score analysis is a new modeling technique developed to control for confounding variables where randomization of subjects is not possible. For example, it is difficult to randomize chronic pain patients to a placebo control group especially for more than a few weeks. As a result, long-term placebo control trials of chronic pain are not feasible. Propensity scores were created, which estimated the likelihood that a particular subject might be using high doses of opioids for chronic pain, based on the pain and demographic characteristics of individuals. HRQoL scores were then compared between subjects who had similar propensity scores, but who were actually using different levels of opioid analgesics. In this manner, we attempted to control for potential confounders of the relationship between opioid use and HRQoL, and to isolate the effect of opioid therapy.
Methods
Study Design
A cross sectional study was conducted in the offices of 235 primary care physicians to assess quality of life and other variables in a sample of patients being treated for chronic pain from 2002 through 2004. The majority of the patients lived in south-central and southeastern Wisconsin. The physicians were contacted directly by the primary investigator of the study (MFF) and were asked to identify patients in their practices who were being treated for chronic pain. The final sample included 801 patients who had been prescribed daily opioids, 115 patients who were receiving intermittent opioid therapy, and 93 patients who had not taken opioids in the previous 6 months. The focus of this analysis is on the 801 patients who were prescribed daily opioids and the 93 patients in a comparison group who were not taking opioids.
Subject Recruitment
Physicians used a number of sources to identify patients being treated for chronic pain, including patient lists from billing records using ICD-9 codes for chronic pain diagnosis, pharmacy records, patient opioid logs maintained by individual physicians, and electronic medical records. The goal of the recruitment effort was to enroll 100% of the chronic pain patients who had been prescribed daily opioids in each of the 235 physician practices, which would minimize selection bias. Once identified, potential patients were mailed a letter of invitation from their primary care physician.
Patients who did not return an “opt-out” post card were contacted by a study researcher by telephone and invited to participate in a face-to-face interview. Response rates were high; only 22% (n = 243) of subjects receiving opioids declining to participate in the study. The primary reasons given for nonparticipation were lack of time, day care issues, confidentiality concerns related to their chronic pain treatment, and transportation barriers. There were significant differences between those who did and did not participate in the study in terms of age and sex. The control group of nonopioid users (n = 93) was selected from the same practices from which the opioid users were recruited.
Patients who met the inclusion criteria were scheduled for a face-to-face interview session during which written informed consent was obtained. All sessions were conducted in a clinical setting. The study provided taxi and bus vouchers, as needed, for subjects to travel to clinic sites. Interviews lasted approximately 2 hours. Subjects were also reimbursed $50 for their time. The study was approved by the Human Subjects Committees of the University of Wisconsin, Aurora Medical Foundation, Medical College of Wisconsin, Dean Care Medical Foundation, Meriter Hospital, and Mercy Health Care.
Data Collection
Interview measures included the Addiction Severity Index,5 from which demographic information about the patients was drawn for the present study. The Addiction Severity Index is a structured interview designed to assess the severity of a subject's addiction issues and has been shown to have good inter-rater concordance and test-retest consistency. A 15-question chronic pain inventory providing information on the type and duration of pain; a prescription medication survey to confirm opioid use and dosing in the previous 6 months; a medical record review of the past 12 months; and the Substance Dependence Severity Scale (SDSS), developed at the New York Psychiatric Institute,6 were also used. The SDSS is a semistructured clinician-administered interview that assesses the severity of the Diagnostic and Statistical Manual of Mental Disorder's (DSM-IV) diagnoses of dependence and abuse and the International Classification of Diseases (ICD)-10 diagnoses of substance dependence and harmful use across a wide range of substances, including alcohol, marijuana, cocaine, opioids, heroin, and methadone, in the 30 days before interview. Good to excellent test-retest stability, internal consistency, and diagnostic concordance have been demonstrated for the ICD-10 dependence severity and frequency scales for all substances.
Patients also self-completed a set of questionnaires. Among them was the Treatment Outcomes in Pain Survey (TOPS), which is comprised of the Short-Form 36 (SF-36) quality of life questionnaire,7 along with supplementary questions that measure family/social disability (in addition to work disability) and the context in which a patient experiences pain, including coping abilities, solicitous responses, and fear-avoidance.8 The SF-36 assesses 8 domains of general health from the patient's perspective: (1) physical functioning; (2) role limitations caused by physical health problems; (3) bodily pain; (4) general health; (5) vitality; (6) social functioning; (7) role limitation caused by emotional problems; and (8) mental health. It has been validated through numerous studies worldwide for use in a variety of health states. With the addition of the supplementary questions, this survey was designed to mirror the concepts outlined in the Nagi disability model and biopsychosocial model of pain. It has been validated for tracking individual- and group-level changes in pain perception over the course of treatment.9 The 44-question Patient Pain Profile (P3) scale, which assesses anxiety, depression, and somatization in pain patients, was also completed by the patients. This survey has been demonstrated to have a high degree of correlation between its scales of depression, anxiety, and somatization and widely used single measures of these constructs.10
Statistical Analysis
Independent Variables
Patients in the daily opioid use group were divided into quartiles of daily morphine/morphine-equivalent doses of opioids. The quartiles included opioid doses of <20 mg/d (n = 267); 20 mg to <40 mg/d (n = 151); 40 mg to <105 mg/d (n = 206); and >105 mg/d (n = 177). The study used morphine sulfate (MS)-equivalent doses for analysis and comparison. MS equivalents were calculated as follows: (1) oycodone and hydrocodone 1:1 with MS; (2) 10 mg of methadone = 30 mg MS; (3) 25 μg of fentanyl = 50 mg MS; (4) 2 mg of hydromorphone = 10 mg MS; (5) 65 mg propoxyphene = 3 mg MS; (6) 50 mg of oral meperidine = 20 mg MS.
All demographic information included in the analyses (including age, sex, race, employment, and marital status) was obtained from the Addiction Severity Index. Monthly income was included as a measure of productivity to control for differences in hourly wage/salary across subjects working a similar number of hours per week. Scores for pain characteristics and interference were taken from single question, interval scale responses on the pain questionnaire and were recorded for each morphine quartile. Mean anxiety, depression, and somatization t scores from the P3 survey (normalized: mean, 50; SD, 10) were also calculated by morphine quartile, as were the percent of patients who met the SDSS criteria for substance abuse, defined as a “usual severity” score of 2 or higher for any substance surveyed in questions 9 to 12 of the SDSS.
Dependent variables
SF-36 responses were abstracted from the TOPS instrument. Physical health (physical function, role physical, bodily pain, general health) and mental health (mental health, role emotional, social functioning vitality) subscales scores, along with US population means, were calculated using the algorithm of Hayes et al.11 Each of the SF-36 subscale scores ranged from 0–100, with 100 representing the highest level of quality of life scores. Patient perception of treatment effectiveness was measured by median score on 3 satisfaction questions of the TOPS instrument (on a 1–6 scale, with higher scores indicating greater satisfaction) and a question from the pain inventory asking patients to rate the difference that taking narcotics made in their ability to perform day-to-day activities (on a 0–10 scale, with higher scores indicating a greater treatment impact).
Unadjusted analyses
Comparisons of mean physical and mental health scores between the chronic pain cohort and the general US population were made using a Student's t test (as part of the Hayes algorithm) whereas differences in median quality of life subscale scores and treatment effectiveness by morphine dose were analyzed with the nonparametric Kruskal-Wallis rank-sum test.
Propensity score matching
A propensity score matched analysis was undertaken to control for observed differences among the treatment groups that might influence quality of life independent of the effects of opioid therapy. The premise of propensity score matching is that meaningful estimates of intervention effectiveness can be discerned in a nonrandomized study design, provided sufficient data are available about the characteristics of those receiving and not receiving the intervention.12,13 With these data, a function is specified that estimates how likely a patient was to have received treatment. Those who received and did not receive the intervention are then matched on this “propensity” to have received the intervention based on observable characteristics. In essence, the technique attempts to mimic the random assignment of patients to a treatment or control group. Comparing the outcome measures of matched subjects can then isolate the effect of an intervention.
These methods were first introduced into the literature by public policy analysts to evaluate the effects of employment training programs on participant earnings in locations where random assignment to program participation was not possible.14 They have recently made their way into health services research and show great potential for expanded use in clinical areas in which randomization to treatment may be infeasible or cost prohibitive. The field of mental health services research has been particularly receptive to the use of matching techniques for estimating treatment effects, but other fields of medicine have been using them as well.15,16
In our study, chronic pain patients receiving high daily doses (>105 mg/d) of opioid analgesics had significantly different characteristics than those receiving lower doses (see Table 1). Because these characteristics potentially influenced the impact of therapy on quality of life outcomes, we used propensity score matching to control for these effects. We first generated a multivariate logistic regression model to estimate propensity scores using the patient characteristics that were found to differ significantly by daily morphine use. These included demographics (age, percent who were African-American, income, and employment); pain characteristics (number of years with pain, level of pain interference with activities); measures of psychological comorbidity (somatization t score on the P3); and other characteristics that have been reported to influence the relationship between opioid use and quality of life (sex, pain severity, anxiety level, substance abuse, and depression score) as independent variables. Morphine-equivalent use above (or below) 105 mg/d was used as the dependent variable. Each patient's odds of being in the highest use group (propensity score) was calculated based on a linear combination of the coefficient estimates for the independent variables.
Patient Characteristics Included in Propensity Score Analysis
Patients in different morphine use groups were then matched on propensity score. Matching was constrained to patients whose propensity scores were within 0.2 standard deviations of each other.17,18 Finally, the difference in SF-36 physical and mental health subscale scores among the matched pairs was calculated and compared with the difference in mean subscale scores found in the unadjusted data. All analyses were performed using SAS Version 9.1 (SAS Institute, Cary, NC). A nominal 2-sided P of .05 was regarded as statistically significant.
Results
Figure 1 compares the frequency of pain diagnoses by the 4 categories of opioid use. The most frequent diagnosis is chronic low back pain followed by arthritis in other joints. Neuropathy and rheumatoid arthritis were other common diagnoses. There were no statistically significant differences between groups for the diagnosis listed in the figure.
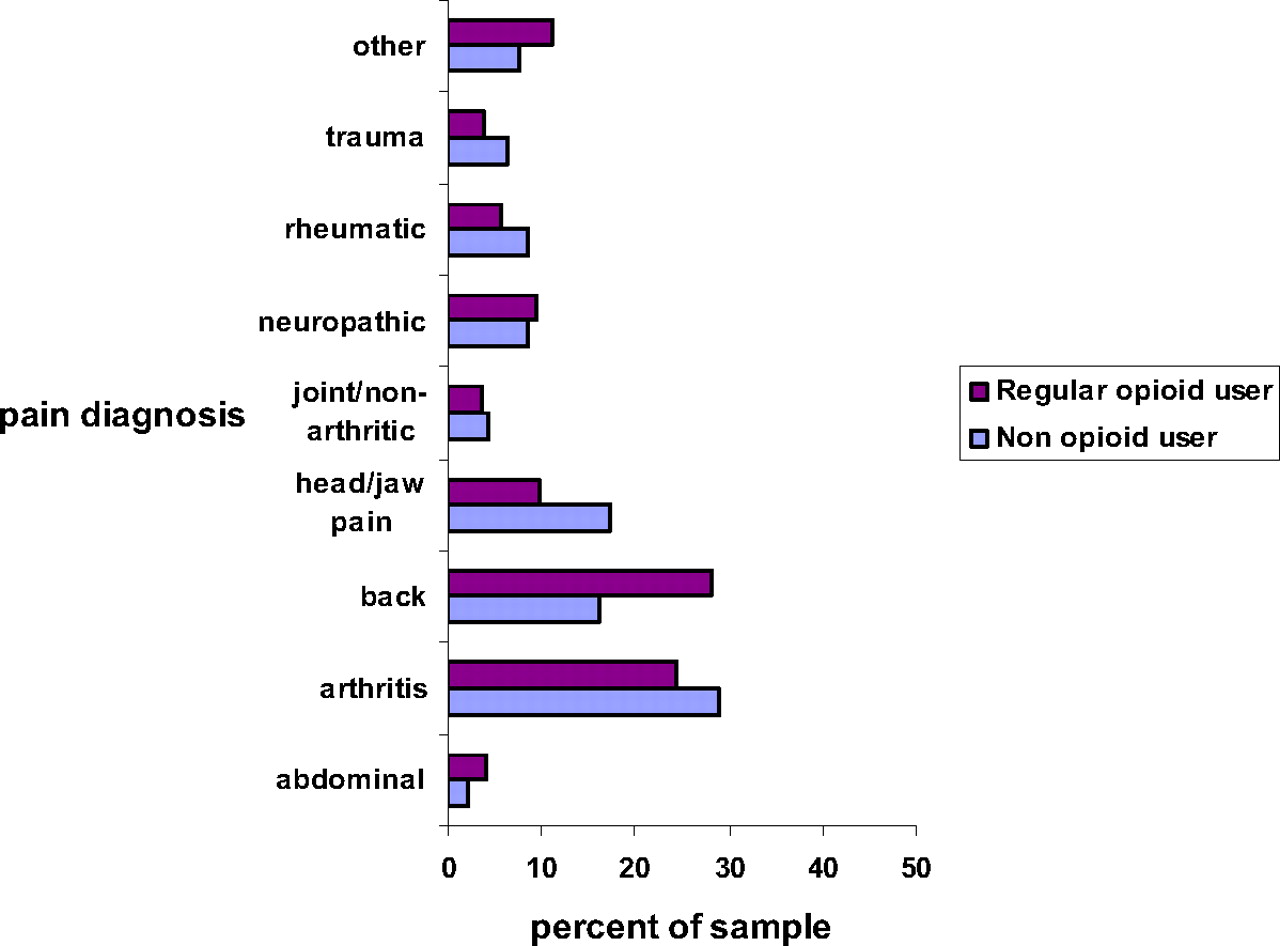
Pain diagnoses among opioid and non-opioid users.
Table 1 presents characteristics for the 5 groups of patients included in this analysis. As noted in the table, the sample is made up of approximately one-third men and mostly white. The high-dose group was less likely to be employed full time and more likely to be on social security disability than the low-dose opioid group (21% vs 38% and 55% vs 40%, respecively). Pain severity scores were similar across the 5 groups, with the average pain score being 6 on a scale of 1 to 10 and the worst being 8.8. The high-dose group reported statistically significant differences in the median duration of pain (18 years; P < .015) and pain interference (mean, 8.0; P < .011). There were no statistically significant differences in P3 mental health scores.
Table 1 also presents the median and range of opioid doses in each group. Use in the high dose group ranged from 105 to 1020 mg. The median duration of opioid therapy was 6.5 years in the total sample of 801 opioid users, with minimal differences in the duration of therapy between groups.
Table 2 presents common side effects associated with opioid therapy. There was no significant difference in adverse effects across the 5 groups based on patients' self-reports. Based on DSM-IV criteria over the previous 30 days, rates of substance abuse disorders were similar across groups. The low prevalence of substance abuse in each group limits the potential for any statistical differences between groups. There were also no differences in rates of common side effects such as constipation, sleepiness, or appetite. Cognitive function, based on the Moment of Symmetry scale, revealed no significant differences between the groups. Not listed was one suicide attempt in the past 30 days within the no opioid group. Lifetime rates of suicide attempts based on data collected from the Addiction Severity Index revealed no differences between groups.
Opioid Dosing and Reported Side Effects
Table 3 presents the unadjusted physical and mental health scores for each opioid use group. Each group had significantly lower scores than US population norms on all 8 quality of life domains (P < .001). Subscale scores for physical health, physical role functioning, and bodily pain showed the greatest decrement relative to the general population, whereas mental health subscale scores were less affected by chronic pain and/or corresponding levels of opioid treatment.
SF-36 Subscale Scores of Chronic Pain Patients Compared with US Norms
Table 3 also illustrates that higher opioid doses were associated with lower quality of life scores across all physical health subscales. For example, in the physical functioning domain (eg, ability to climb stairs, lifting or carrying groceries, walking more than a mile) the general US population has a mean score of 82 (scale of 0–100), the no opioid group had a mean score of 43.0, and the high-dose group had a mean score of 32.3. For the physical role scale (ie, had difficulty performing work, accomplished less than would have liked) the population norm was 81.2, the no opioid group 25.2, and the high-dose group 16.5. This suggests that patients receiving greater than 105 mg/d of morphine equivalent were more physically impaired than patients on lower opioid doses or no opioids.
With respect to the mental health subscales presented in Table 3, there were no significant differences between the control and opioid groups in 2 of the subscales: overall mental health (eg, “In the past 4 weeks did you feel full of pep?”, “Have you felt down in the dumps?”, “Do you feel worn out?”) and emotional role functioning scores (eg, “As a result of emotional problems have you cut down on the amount of time spent on activities?”, “… accomplished less than you would have liked?”).
Table 4 presents the results of 5 satisfaction questions. There were significant differences on 3 of the 5 questions; the high-dose opioid group reported higher levels of satisfaction. This group reported greater satisfaction on the questions, How satisfied are you with your current treatment to date? (P < .04), and, How satisfied are you with the overall results of your treatment to date? (P < .01). They also felt that “narcotics made a significant difference in the day-to-day activities in their life” (P < .01). The 2 questions for which no differences were found asked whether they had “increased physical ability to deal with their pain” and “lack of control over their pain.”
Opioid Use and Perception of Treatment Efficacy
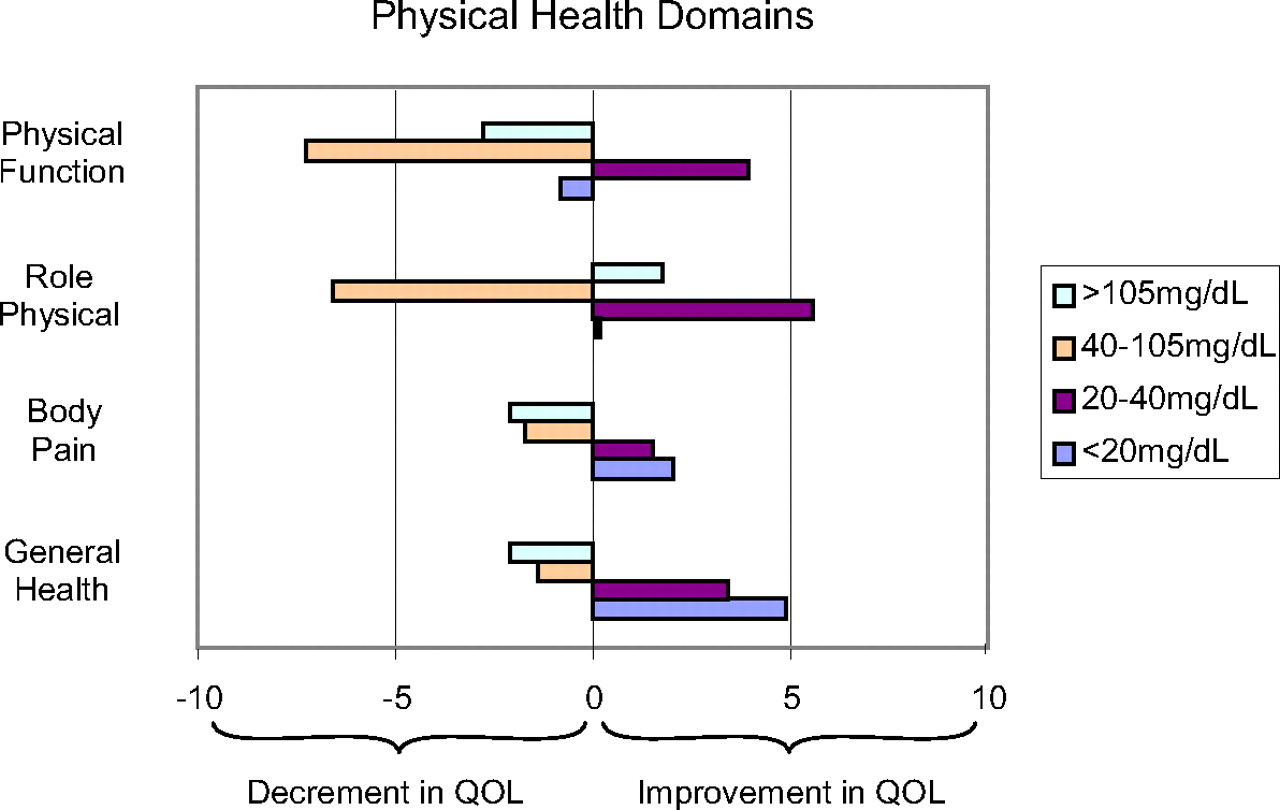
Figures 2 and 3 present the adjusted results of opioid therapy created through propensity score matching. Significant overlap in propensity score distributions among morphine quartiles allowed for matching of nearly 95% of our sample for these analyses. The scores represent the mean differences in quality of life domains between the control group and the 4 levels of opioid use groups. Scores >0 indicate statistically significant increases in quality of life among the opioid users relative to the control group. Scores <0 indicate a decrement in quality of life in the opioid use group.

Propensity score adjusted difference in SF-36 physical health domain scores versus non-opioid users.

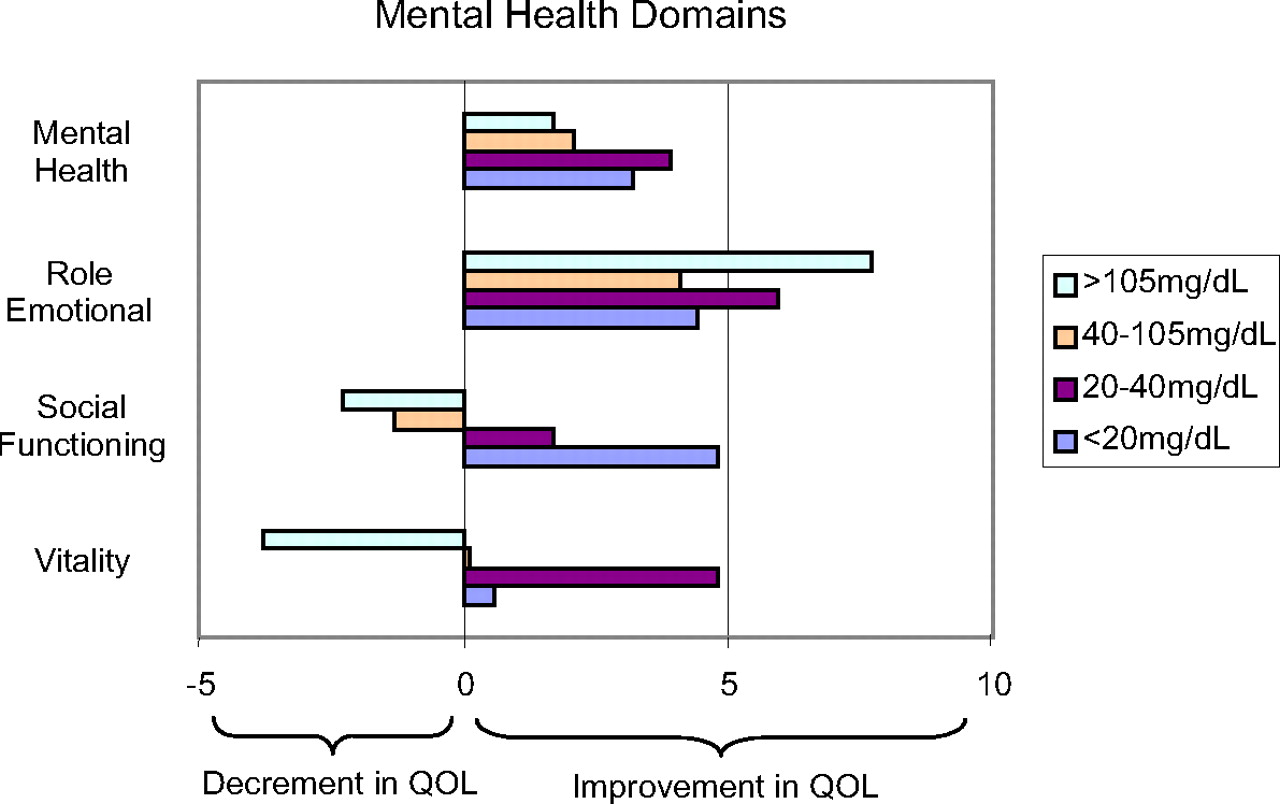
Propensity score adjusted difference in SF-36 mental health domain scores versus non-opioid users.
The findings in Figures 2 and 3 can be best interpreted by examining the analysis for the <20 mg/d users, the 20 mg to 40 mg/d users, and those using >40 mg/d. These results indicate a statistically significant improved quality of life across 6 of the 8 domains with low-dose opioid therapy (<20 mg) compared with the no-use group. Those using 20 mg to 40 mg/d seemed to have higher quality of life scores on all 8 domains of physical and mental health relative to the non-opioid use chronic pain patients when controlling for pain and demographic characteristics, a result not observed in the unadjusted results. Finally, those in the highest 2 quartiles of morphine use have the lowest quality of life scores, but the decrement in score with increasing opioid dose was not as great as that seen in the unadjusted results.
Discussion
This analysis was designed to evaluate the impact of opioid therapy on HRQoL and patient satisfaction by comparing scores on a standard HRQoL scale (SF-36) across groups of patients who had been prescribed varying doses of daily opioid therapy. The sample consisted of 801 primary care patients receiving long-term opioid therapy for common disorders such as back pain, arthritis, neuropathy, and headaches, and 93 control subjects not receiving opioid therapy. The median duration of pain in the opioid using sample was 16 years and the median duration of opioid use to treat pain was 6.5 years. The sample was obtained from a diverse group of 235 primary care physicians located in 8 Wisconsin counties and included urban, suburban, and rural areas.
The study found a number of important results: (1) a higher quality of quality of life score on 4 SF-36 physical domains in patients on low-dose opioids (5 mg to 40 mg/d) compared with the other groups; (2) a greater effect of low-dose therapy (<40 mg/d) in the propensity score matched analysis; (3) significant lower quality of life scores in the high-dose opioid group; and (4) higher levels of patient treatment satisfaction in the high-dose group compared with the control group.
For the treatment of pain, physicians are taught to increase the dose of opioids until pain is reduced and physical function improves. However, the results of this study suggest that, in general, higher dose opioids do not necessarily contribute to an overall improvement in physical health quality of life in chronic pain patients. Even when comparing scores between patients who are matched on multiple pain and demographic characteristics, as we did in our propensity score analysis, quality of life scores remained significantly lower across physical health and bodily pain domains for those using daily opioids >40 mg/d of morphine equivalents.
Another finding is the absence of high rates of current substance use disorders or serious adverse effects in any of the groups. One of the major concerns of physicians and health care leaders in the use of opioid therapy is the development of addiction. The overall frequency of current DSM-IV substance use disorders in our sample was 9.9%. The rates of substance abuse disorders is similar to general population rates of 9.2%, as reported in the 2006 national survey of drug abuse conducted by the Center for Substance Abuse Prevention.19 In addition, there were no significant differences in common side effects such as constipation, diarrhea, nausea, vomiting, and/or rashes between the groups based on patient self-report. There were no differences in cognition based on the Moment of Symmetry questionnaire. Therefore, opioid use in this sample does not seem to be associated with serious adverse events (including patients in the high-dose group).
What are the implications of these results for the clinician who is treating CNCP patients with opioid analgesics? First, chronic pain patients have significantly worse HRQoL compared with US population norms regardless of their opioid use status, so a return to “normal” quality of life with opioid therapy may be an unrealistic goal. Second, the findings of this report support recent recommendations that primary care physicians limit opioid dosing to <100 mg/d.20–22 Physicians may be able to justify higher doses in cases where pain is not well controlled with lower doses and the goal is relief of pain and suffering and not improved function. Finally, side effects were uncommon in our primary sample. We also did not find a dose-response effect with opioid therapy. The high-dose opioid group had rates of substance use disorders, constipation, nausea, somnolence, and cognitive function similar to those of the low-dose group.
Strengths of the study include a large sample of patients receiving opioids for pain from their primary care physician (n = 801), a number of different pain diagnoses, a diverse sample (over 25% were from under-represented minorities), a high patient response rate (78%), administration of contemporary research instruments, and use of a propensity score analysis to adjust for potential confounding variables. The primary weakness of the study is absence of pre-opioid use quality of life information. In addition, propensity score matching only controls for bias associated with observable factors. Unobserved confounders that are not strongly associated with observed characteristics may bias results. For instance, the design did not allow us to examine side effects before the study period. Patients with severe effects (ie, addiction, cognitive, respiratory effects) may have been taken off of opioids before our study period because the average duration of opioid use was 6.5 years. Prospective randomized, long-term cohort studies are needed to determine optimum doses of opioids and potential long-term benefits.
The primary limitation of the study relates to potential selection bias. However, we used a number of strategies to minimize this potential weakness. All patients from each of the practices who were using opioids for chronic pain were identified and contacted for the study. Methods used to ensure we identified all patients who received opioids in each of the 235 practices included a review of medication logs, medical records, treatment contracts, scheduling records, and working closely with each physician and their nursing staff. Because there were so few patients receiving opioids in each of the practices (ie, the average physician had between 4 and 5 patients on opioids), we obtained the names of as close to 100% of all potential patients as was possible in community-based primary care practices. Methods to contact and enroll patients included direct contact by their primary care physician, timely and persistent follow-up phone calls, conducting the interview at a time and location convenient to the patient, and travel assistance. Although it is true our sample consists of patients on long-term opioids and does not include patients who were taken off of opioids because of side effects or addiction, the study provides new information on a group of primary care patients in which we have limited information on long-term quality of life.
Conclusion
What is the optimum dose of opioid therapy? After controlling for a number of important covariates, this study supports the notion that low-dose opioid therapy (20 to 40 mg) can improve physical function, decrease pain, and improve overall health compared with no opioid therapy. The study also found that although high-dose therapy does not improve physical well being, patients do report feeling better and have greater levels of satisfaction. The optimum dose of opioids seems to depend on the goals of therapy. For patients who want to return to work or to resume a physically active lifestyle, low-dose opioids may be the best strategy. For patients who are physically handicapped with limited expectations and simply want to feel better, higher doses may be a more appropriate treatment. Other important factors to consider when deciding on an opioid dose include the presence of substance abuse disorders, mental health problems, sleep apnea, respiratory status, cognitive function, and comorbid medical disorders.
Notes
This article was externally peer reviewed.
Funding: This study was supported by National Institutes of Health/National Institute on Drug Abuse grant no. 5R01DA013686-02.
Conflict of interest: none declared.
- Received for publication June 4, 2007.
- Revision received October 19, 2007.
- Accepted for publication October 24, 2007.


