
Abstract
Background: Published studies about the association of obesity with mortality have used body mass index (BMI) data collected more than 10 years ago, potentially limiting their current applicability, particularly given evidence of a secular decline in obesity-related mortality. The objective of this study was to examine the association between BMI and mortality in a representative, contemporary United States sample.
Methods: This was a population-based observational study of data from 50,994 adults aged 18 to 90 years who responded to the 2000 to 2005 Medical Expenditures Panel Surveys. Cox regression analyses were employed to model survival during up to 6 years of follow-up (ascertained via National Death Index linkage) by self-reported BMI category (underweight, <20 kg/m2; normal weight, 20-<25 [reference]; overweight, 25-<30; obese, 30-<35; severely obese, ≥35), without and with adjustment for diabetes and hypertension. Survival by BMI category also was modeled for diabetic and hypertensive individuals. All models were adjusted for sociodemographics, smoking, and Medical Expenditures Panel Surveys response year.
Results: In analyses not adjusted for diabetes or hypertension, only severe obesity was associated with mortality (adjusted hazard ratio, 1.26; 95% confidence interval, 1.00–1.59). After adjusting for diabetes and hypertension, severe obesity was no longer associated with mortality, and milder obesity (BMI 30-<35) was associated with decreased mortality (adjusted hazard ratio, 0.81; 95% confidence interval, 0.68–0.97). There was a significant interaction between diabetes (but not hypertension) and BMI (F [4, 235] = 2.71; P = .03), such that the mortality risk of diabetes was lower among mildly and severely obese persons than among those in lower BMI categories.
Conclusions: Obesity-associated mortality risk was lower than estimated in studies employing older BMI data. Only severe obesity (but not milder obesity or overweight) was associated with increased mortality, an association accounted for by coexisting diabetes and hypertension. Mortality in diabetes was lower among obese versus normal weight individuals.
Overweight and obesity have increased dramatically,1 with adverse public health implications. Above-normal body mass index (BMI) is associated with decreased functional ability and health status2 and increased risk of chronic conditions such as diabetes and hypertension, which often cause further decrements in health.3 However, the contemporary relationship between BMI and mortality, and how BMI interacts with diabetes and hypertension to influence mortality, are unclear.
Studies conducted more than 30 years ago suggested incrementally rising mortality risk with each increase in BMI category above normal,4 prompting predictions of reduced life expectancy because of burgeoning obesity.5 However, subsequent studies of BMI data collected 10 to 30 years ago have found consistently increased mortality risk only among severely obese persons (BMI ≥35 kg/m2), with mixed findings among overweight (BMI 25.0–29.9 kg/m2) and more mildly obese (BMI 30.0–34.9 kg/m2) persons.6⇓⇓⇓⇓⇓⇓⇓⇓⇓⇓⇓⇓–19 Collectively, these findings suggest a secular decline in the mortality risk of those with above-normal BMI.
Secular trends in population obesity suggest the need for studies employing more recently collected BMI data.1 Examining the current relationships among obesity, its principal morbidities (hypertension and diabetes), and mortality would help assess whether these relationships have changed.20,21 Elucidating current relationships among diabetes, BMI, and mortality is particularly relevant given the adoption in the 1990s of a lower threshold for diagnosing diabetes.22 Using national data from the 2000 to 2005 Medical Expenditures Panel Surveys (MEPSs),23 linked with the National Death Index (NDI) through 2006,24 this study examined the association between self-reported BMI and all-cause mortality among US adults and the degree to which BMI moderates mortality risk in diabetes and hypertension during up to 6 years of follow-up.
Methods
Procedures
MEPS is an annual national survey of health care use and costs in the civilian, noninstitutionalized population in the United States, employing an overlapping panel design.23 The analytic sample for the current study included persons aged 18 to 90 years at entry. The study was exempted by the University of California Davis Institutional Review Board.
The MEPS Household Component (HC) includes information about respondent sociodemographics and health insurance. A self-administered questionnaire includes items about respondent smoking and health conditions. The full-year response rate varied from 70% to 66.5% for the 2000 to 2005 panels we used.23 The MEPS HC sample is a subsample of households included in the previous year's National Health Interview Survey (NHIS), conducted annually by the National Center for Health Statistics. The NHIS is linked to death certificate data in the NDI, a central computerized index of US death record information on file in states' vital statistics offices, in turn permitting linkage to the MEPS.24
Measures
BMI (kg/m2) was constructed from self-reported height and weight. BMI categories employed in analyses were underweight (<20 kg/m2); normal weight (20-<25 kg/m2); overweight (25-<30 kg/m2); obese (30-<35 kg/m2); and severely obese (≥35 kg/m2). These categories correspond to those widely employed by clinicians, except for the underweight and normal weight categories, which typically were defined in clinical practice and most research before 2000 as <18.5 and 18.5 to <25 kg/m2, respectively.25 A BMI of <20 kg/m2 was employed to distinguish underweight in the primary study analyses, on the basis of research indicating that adjusted mortality increases sharply below that level, likely reflecting the effects of concurrent illnesses.26 Thus, classifying individuals with a BMI of 18.5 to <20 kg/m2 as normal weight artificially increases the mortality risk associated with normal weight and decreases the apparent mortality risk associated with overweight and obesity.
Mortality was assessed via the NDI with the public-use version of the NHIS-linked mortality files.24 Calibration studies indicate that, overall, 98.5% of respondents are classified correctly by their death date or as alive.24 Survival was measured in quarters from the time of the health measure self-assessment until the time of death, or they were considered censored if alive on December 31, 2006.
Health Conditions and Sociodemographics
Self-reported diabetes and hypertension status each were dichotomized as present or not. Self-reported smoking status was dichotomized as current smoker or not. Sociodemographic variables examined were age (years); sex; race/ethnicity (Hispanic, white, black, or other; Hispanic ethnicity took categorical precedence over race); US Census region (West, Midwest, Northeast, South); urbanity (living in a metropolitan statistical area or not); education level (0–8 years of formal schooling [less than high school], 9–11 years [some high school], 12 years [high school graduate], 13 to 15 years [some college], and >16 years [college graduate]); household income level (<100%, 100–124%, 125–199%, 200–399%, or >400% of the Federal Poverty Level [FPL]); and health insurance status (uninsured, privately insured, or publicly insured).
Data Analysis
Data were analyzed using STATA version 11.2 (Stata Corp, College Station, TX), adjusting for the complex survey design of the MEPS. Data were analyzed using longitudinal strata, primary sampling unit identifiers, and survey weights to derive estimates representative of the US civilian, noninstitutionalized adult population.
Analyses examining associations between BMI category and subsequent mortality utilized Cox proportional hazards survival models. The proportional hazards assumption was examined in each analysis both graphically and statistically, and no substantial evidence of violation was found. Two models were employed to examine mortality by BMI category: one without and one with adjustment for diabetes and hypertension. A third model, focused on mortality associated with diabetes by BMI category, adjusted for diabetes (but not hypertension) status and included a diabetes (present)*BMI interaction term. A fourth model, focused on mortality associated with hypertension by BMI category, adjusted for hypertension (but not diabetes) status and included a hypertension (present)*BMI interaction term. Findings of the models including diabetes (present)*BMI and hypertension (present)*BMI interaction terms are presented in the tables as hazard ratios. However, because the main effects of BMI on mortality cannot readily be interpreted in the presence of these interaction terms, the findings of these models are presented in a figure as adjusted relative hazards, incorporating the interaction effects. All analyses were adjusted for sociodemographic characteristics (age, sex, race/ethnicity, education, household income, health insurance status, urban versus rural residence, and Census region). Analyses also were adjusted for MEPS survey year, which was included as a categorical variable.
To facilitate comparisons with prior studies, supplementary analyses were conducted with normal weight defined as a BMI of 18.5 to <25 kg/m2 and underweight BMI as <18.5 kg/m2. Given the higher prevalence of obesity and lower adjusted mortality rate among Hispanic versus white persons (the analytic reference group), another supplementary analysis was conducted to explore race/ethnicity*BMI interaction effects on mortality risk.
To explore the potential influence of biased self-reporting of height and weight on the study findings, 2 additional supplementary analyses were conducted. Prediction models were used, predicting measured BMI (pmBMI) from self-report BMI (sBMI) information using contemporary datasets in which both pmBMI and sBMI were available. One model used a prediction model developed by Statistics Canada (Ottawa, Ontario, Canada).16 For men, pmBMI = 1.05*sBMI – 0.12; for women, mBMI = 1.08*sBMI – 1.08.16 The other prediction model used data from the 2001 to 2006 National Health and Nutrition Examination Surveys.27 This latter prediction formula, developed separately for men and women, used as predictors sBMI, the squared deviation from the mean sBMI, age, and the squared deviation from the mean age. For men, pmBMI = 0.0115* age + 0.0002*(age – 50.52)2 + 1.0246*sBMI – 0.0022*(sBMI – 27.68)2 (R2 = 89.4%.) For women, pmBMI = –0.0008* age + 0.0005*(age – 50.52)2 +1.050*sBMI – 0.0053*(sBMI – 27.68)2, (R2 = 91.2%). This correction model increased the correct classification of severe obesity from 75.2% to 83.4% and the correct classification of obesity from 70.2% to 77.8%, with no increase in the correct classification of overweight (from 79.5–80.1%).
Results
There were 66,952 eligible adults aged 18 to 90 years entering the MEPS cohorts between 2000 and 2005; 50,994 (76%, population weighted) had complete baseline data and mortality ascertainment. Among the 50,994, 1,683 died (3.1%, population weighted) during 199,470 person-years of follow-up; 17,348 (34%) were followed for more than 5 years.
Primary Analyses
Table 1 summarizes the characteristics of the analytic sample by BMI category. Severely obese individuals were more likely to be middle aged, female, Hispanic or black, have attended or graduated from high school, have an income of 200% to <400% of the FPL, reside in the Midwest or South, and have diabetes or hypertension. By contrast, persons with income ≥400% of FPL, residents of the West, and smokers were relatively underrepresented in the severely obese category.
Table 2 shows the adjusted associations between BMI categories and mortality without and with adjustment for diabetes and hypertension. In both models, compared with normal weight, underweight was significantly associated with increased mortality risk, whereas overweight was significantly associated with reduced mortality risk. There were small differences in the hazard ratios for these BMI categories without and with adjustment for diabetes and hypertension. Milder obesity (BMI 30-<35 kg/m2) was not significantly associated with mortality in the model without diabetes and hypertension, but it was associated with lower mortality in the model adjusting for these conditions. There was an association between severe obesity and mortality in the model without diabetes and hypertension but no association after adjusting for these conditions.
Table 3 shows the adjusted associations between BMI categories and mortality, including adjustment for diabetes (but not hypertension) status and a diabetes (present)*BMI interaction term. There was a significant interaction between diabetes and BMI (F[4,235] = 2.71; P = .03), such that the mortality risk of diabetes was lower among obese and severely obese persons than among those in lower BMI categories. Figure 1 depicts the adjusted mortality hazard by BMI category with and without concurrent diabetes and indicates that the adverse influence of diabetes on survival was most pronounced among normal weight individuals. Similar analyses adjusting for hypertension (but not diabetes) status and a hypertension (present)*BMI interaction term were conducted and found no significant interaction effect on mortality (F[4,235] = 1.08; P = .36).
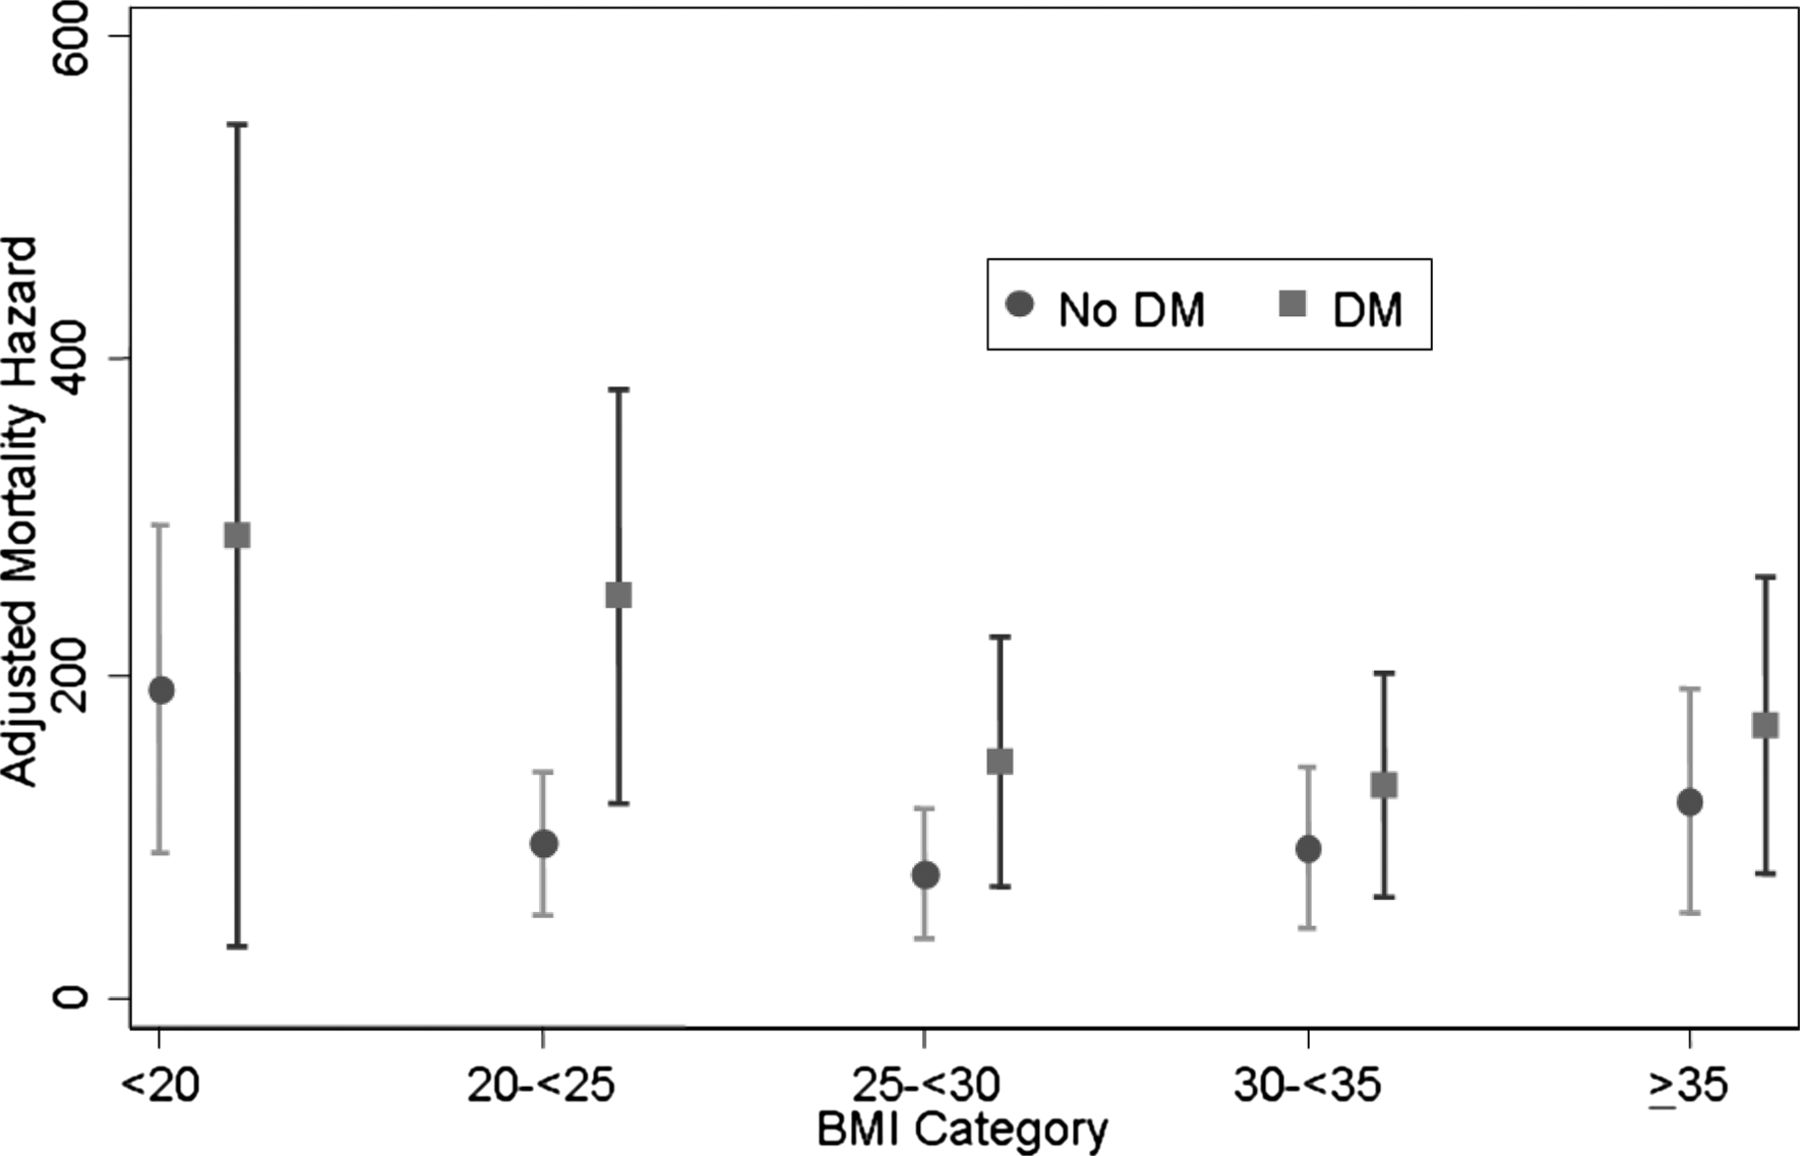
Adjusted mortality hazard among individuals without and with diabetes, by body mass index category. Bars around point estimates indicate 95% confidence interval. Analyses have been adjusted for sociodemographic characteristics (age, sex, race/ethnicity, education, household income, health insurance status, urban versus rural residence, and Census region) and Medical Expenditure Panel Survey response year. BMI, body mass index (kg/m2); DM, diabetes mellitus.
Supplementary Analyses
Supplementary analyses with normal weight defined as a BMI of 18.5 to <25 kg/m2 and underweight BMI <18.5 kg/m2 yielded findings that did not differ substantively from those of the primary analyses, with evidence of lower apparent risks associated with higher weight categories. For example, in the model not adjusting for comorbidity, the adjusted hazard ratio for overweight was 0.77 (95% confidence interval, 0.67–0.89). There was also no significant race/ethnicity*BMI interaction effects on mortality risk. In both of the supplementary analyses of BMI values adjusted for self-report bias—one based on the Statistics Canada prediction model and the other based on National Health and Nutrition Examination Surveys 2001 to 2006 data—there was lower mortality associated with increasing BMI category than in the primary analyses employing self-report data. Details of all supplementary analyses are available by request.
Discussion
It is instructive to interpret the study findings in the context of previous broadly representative studies examining the association of BMI and mortality across the adult life spectrum (eg, not limited to the elderly), all of which employed BMI data collected more than a decade ago. In this study, overweight was associated with decreased mortality risk, whereas prior studies were mixed in this regard, with most finding either no association of overweight with mortality or increased risk.6⇓⇓⇓⇓⇓⇓⇓⇓⇓⇓⇓⇓–19 Although all but one16 of the prior studies found milder obesity (BMI 30-<35 kg/m2) was associated with increased mortality risk,6⇓⇓⇓⇓⇓⇓⇓⇓–15,17⇓–19 in this study, obesity of this degree was not significantly associated with mortality in a model unadjusted for diabetes and hypertension and was not significantly associated with decreased mortality after adjusting for these conditions. Regarding severe obesity, as in the relatively fewer prior studies examining this category separately,15⇓⇓⇓–19 this study found it to be associated with significantly increased mortality risk without adjusting for diabetes or hypertension. However, severe obesity was no longer significantly associated with mortality after adjusting for these conditions, something not examined in the prior studies. Considered in the context of prior studies, these findings suggest that the mortality risk of above-normal BMI, at least in the short term, may be lower in the current era than in the past. This apparent temporal change in the association between BMI and mortality was more marked when we employed a normal BMI reference category of 18.5-<25 kg/m2, as used in prior studies. Including persons with a BMI <20 as the normal reference category reduces the apparent mortality risk of above-normal BMI. Although this study did not directly examine secular changes in BMI-associated mortality, a prior US study found evidence for early stages of a temporal decline in BMI-associated mortality beginning in the late 1970s.8 The findings of this study are consistent with the continuation of this trend.
The study also helps to clarify the contemporary influence of BMI on mortality risk among individuals with diabetes or hypertension. Regarding diabetes, prior work employing data collected before widespread obesity found a higher mortality risk among diabetics with higher versus lower BMIs.20 However, the mortality risk of diabetes in the current study was lower among individuals with higher versus lower BMIs, further supporting the notion of a secular decline in obesity-related, short-term mortality risk. By contrast, consistent with most prior studies examining this issue (all employing data collected 30–40 years ago),21 there was no evidence of a significant interaction between hypertension and BMI, indicating their effects on all-cause mortality are independent of each other at all levels of BMI examined. Increasing surveillance bias influencing the identification of diabetes may partly account for the finding of lower mortality risk among diabetics with higher BMI. In the current era, an increasing proportion of type 2 diabetics are severely obese.28 The diagnosis of relatively mild diabetes may be more likely among such individuals because of heightened clinician suspicion of (and related increased testing for) the disease, and milder cases of diabetes may be associated with relatively low mortality risk. Also relevant is the lowering of the fasting plasma glucose threshold for diagnosing diabetes to ≥126 mg/dL in the 1990s.22 Partly because of that change, the age-adjusted incidence of diabetes has nearly doubled.29 By contrast, the diagnostic threshold defining hypertension (≥140/90 mm Hg) has not changed since the early 1980s.
Strengths of this study included the use of nationally representative BMI data collected within the past decade and determination of BMI-mortality associations both without and with adjustment for hypertension and diabetes. The study also had some limitations. The analyses were observational, so causal associations cannot be inferred. BMI in our study was derived from self-reported height and weight. A number of studies also employed BMI determined from self-reported height and weight data collected before the year 2000 and found BMI-mortality associations similar to those found in contemporaneous studies of measured BMI.7,11⇓–13,30 Prior studies suggest a complex relationship between self-reported and objectively measured BMI, with differences in BMI category misclassification resulting from use of self-report data of sociodemographic characteristics (eg, country of residence, sex, race), and BMI category (eg, tendency to underestimate BMI among those with higher BMI vs overestimated BMI among individuals with lower BMI).31⇓⇓⇓–35 The net effects of such relationships on the BMI-mortality associations observed in a diverse, nationally representative sample such as ours are uncertain. However, in 2 supplementary analyses employing BMI values derived by applying formulas aimed at adjusting for self-report bias, we noted findings suggesting less risk of mortality associated with higher BMI categories. Thus, it seems unlikely that the relatively attenuated associations between BMI and mortality we observed compared with earlier studies simply reflect biased self-reporting of height and weight.
Diabetes and hypertension also were self-reported in our study. Although studies suggest that self-report of these conditions is reasonably accurate,36,37 misreporting leading to respondent misclassification could have obscured true BMI-mortality relationships, especially if misreporting varied by BMI category. We also were unable to distinguish type 1 from type 2 diabetes in our data set. However, given the epidemiology of the conditions, it is likely that type 1 diabetics were relatively over-represented in the lower BMI categories. At first glance, this might seem to help explain the apparent protective effect of higher BMI on mortality that we observed in diabetics; people with type 1 diabetes generally may have had the diagnosis longer than those with type 2 diabetes and so might be posited to have developed more risk factors for premature mortality (eg, renal impairment manifested by microalbuminuria). However, at least 3 lines of evidence suggest this is unlikely. First, type 1 diabetes only accounts for an estimated 5% to 10% of all diagnosed cases of diabetes in the United States,38 so our mortality findings likely were driven primarily by the association of BMI with mortality among type 2 diabetics. Second, some work suggests that the prevalence of risk factors for death caused by cardiovascular disease seems to be higher in type 2 versus type 1 diabetics with similar durations of diagnosis.39 Third, 5-year adjusted mortality risk seems to be 3- to 4-fold higher for type 2 versus type 1 diabetics.40 In other words, the true protective effect of overweight and nonsevere obesity on mortality in type 2 diabetes may be somewhat larger than the effect observed here. Nonetheless, further studies employing recently collected, objectively verified BMI and health condition data are needed to verify our findings.
The study also employed a relatively short follow-up period (up to 6 years) for mortality ascertainment, with only about one third of respondents having more than 5 years of follow-up. An increased mortality risk of obesity could require longer exposure to emerge. A prior review suggested at least 5 years' follow-up was needed to demonstrate the effects of obesity on mortality.41 However, the recommendation was derived largely from studies of small local or regional cohorts, with variation among studies in the duration of obesity before study enrollment. Furthermore, some large national studies of data collected before the era of prevalent obesity employed follow-up periods as short as or shorter than ours7,11 and nonetheless observed significant effects of obesity on mortality. MEPS nonresponse also may have produced some bias, with uncertain applicability of our findings to nonresponders. Whether the current findings are applicable to countries and territories other than the United States requires further study.
Given the substantial burden of morbidity entailed by overweight and obesity,2,3 the study findings should not be construed to mean that overweight and obesity no longer represent major threats to individual and public health. Rather, the findings may prove useful in guiding research aimed at developing effective clinical and population-level efforts to address overweight and obesity. For example, they suggest that efforts to reduce mortality among the overweight and obese might be targeted most productively at individuals with coexisting diabetes, hypertension, or both. The findings also raise the question of whether efforts to reduce mortality among diabetics should be targeted primarily to commonly co-occurring health risks associated with increased mortality risk, such as physical inactivity and smoking,42,43 rather than weight. Given the observational nature of the current analyses, these notions represent hypotheses to be tested in randomized controlled trials.
Conclusions
In a study of US national data collected during 2000 to 2006, obesity (BMI 30-<35 kg/m2) was not associated with increased mortality risk during up to 6 years of follow-up. Although severe obesity (BMI >35 kg/m2) was associated with increased mortality risk, the association was accounted for by coexisting diabetes and hypertension. Finally, the mortality risk of diabetes was lower among both obese and severely obese persons than among those in lower BMI categories. Thus, in this study, the mortality risk associated with obesity was lower than in previous studies, which employed BMI data collected more than 10 years ago.
Notes
This article was externally peer reviewed.
Funding: none.
Conflict of interest: none declared.
- Received for publication October 13, 2011.
- Revision received January 17, 2012.
- Accepted for publication January 23, 2012.
References
In this issue


Jump to section
Related Articles
Cited By...
- BMI and All-Cause Mortality in Normoglycemia, Impaired Fasting Glucose, Newly Diagnosed Diabetes, and Prevalent Diabetes: A Cohort Study
- BMI and all cause mortality: systematic review and non-linear dose-response meta-analysis of 230 cohort studies with 3.74 million deaths among 30.3 million participants
- J-shapedness: an often missed, often miscalculated relation: the example of weight and mortality
- Content Usage and the Most Frequently Read Articles by Issue in 2012
- Cardiovascular Diseases and Other Evidence for Primary Care Clinical Practice