
Abstract
Background: From March 2009 through February 2011, the National Health Service Corps (NHSC) received a $300 million supplement through the American Recovery and Reinvestment Act to grant more loan repayment awards to clinicians who agree to work in underserved areas. This study assesses how this unprecedented funding increase affected the size, composition, and location of the NHSC's workforce.
Methods: This was a descriptive, time-linked, observational study using NHSC administrative data. Main outcomes were growth and changes in disciplinary composition of the NHSC's workforce and in its rural/urban and state-to-state distribution.
Results: During the Recovery Act period, the NHSC's workforce increased by 156%, from 3017 to 7713 clinicians. Mental health clinicians grew most numerically (210%) and as a proportion of the NHSC's workforce (from 22.7% to 27.4%). Primary care clinicians grew least and decreased as a proportion of the NHSC's workforce to 58.9%; dental health clinicians remained steady at approximately 13.5%. Among individual disciplines, physicians decreased most as a component of the NHSC's overall workforce, from 38.6% to 26.7%, whereas the proportion of nurse practitioners grew most, from 10.1% to 16.0%. Proportions of the NHSC's workforce serving in rural areas changed only modestly. NHSC clinician numbers grew most in states with the lowest NHSC clinician-to-poverty population ratios before the Recovery Act.
Conclusions: With Recovery Act funding, the NHSC's workforce become far larger and more diverse than ever and more evenly distributed across states. The NHSC should now set targets and be more deliberate in managing its growth across disciplines and where its clinicians serve.
- American Recovery and Reinvestment Act
- Health Personnel
- Health Policy
- National Health Service Corps
- Primary Health Care
- Rural Health
The National Health Service Corps (NHSC) is the largest and most visible public program working to address the geographic maldistribution of the US health care workforce.1,2 Through scholarships to students and repaying the education loans of recent graduates,2 the NHSC makes work in community health centers and practices in other health professional service areas (HPSAs) financially possible and even attractive.
The NHSC was initially a program for primary care practitioners and dentists,3 but it now has broadened to offer loan repayment to mental health professionals and dental hygienists. During its 40-year history, the NHSC's in-the-field practitioner workforce has waxed and waned with fluctuations in its funding, sometimes to the frustration of needy communities.4,5 Its workforce peaked in 1986 with 3100 clinicians and peaked again in 2005 with 4602 clinicians,6⇓–8 but it has never come close to meeting the estimated need for providers within HPSAs, which totaled 31,623 clinicians as of early 2009.9 Supporters have long advocated for a larger NHSC.4,10⇓–12
In February 2009, America's Recovery and Reinvestment Act (“Recovery Act”)13 committed $787 billion over 24 months to stimulate the US economy, create jobs, and build the nation's critical infrastructure. The Recovery Act designated $300 million to expand the NHSC.13⇓–15 With its recent regular annual federal appropriation funding of approximately $125 million a year, the Recovery Act promised to add more than 4000 clinicians to the NHSC's workforce,14,16 by far the largest and most rapid growth in the NHSC's history.
The NHSC responded quickly.14,16,17 Able now to fill more positions, the NHSC extended loan repayment eligibility to practices within all HPSAs rather than to just a subset of the most needy. Federal and state recruitment staff helped newly eligible practices apply for NHSC site designation.16,18 The online application system for clinicians was streamlined and applications were now reviewed quickly and awards made continually rather than just once a year. Through these and other efforts, the NHSC was able to make the last of its awards with Recovery Act funds in February 2011, within the 24-month deadline.14
With the period of Recovery Act funding now past, we ask in this study how this unprecedented funding amount has affected the NHSC's workforce size, composition, and location. Did the NHSC's workforce change because some disciplines responded more vigorously than others to the short-notice expansion of loan repayment opportunities? Did broadened site eligibility and more available sites change the balance of the rural/urban locations where the NHSC's clinicians serve or their distribution across the states? Clarifying how Recovery Act expansion changed the NHSC's workforce can be important because the NHSC continues to grow, with an additional approximately $300 million supplement each year through 2017 under the Patient Protection and Affordable Care Act of 2010 (“Affordable Care Act”).19,20
Methods
We obtained data from the Bureau of Clinician Recruitment and Service's Management Information System Solution (BMISS), the NHCS's administrative database that contains detailed information about its clinicians and sites. We received raw data for every clinician actively serving in the NHSC's Scholarship and Loan Repayment Programs on the last day of each federal calendar quarter from September 30, 2007, through December 31, 2010, and on February 28, 2011, approximately 2 weeks after the last NHSC contracts were made with Recovery Act funding. The BMISS database does not contain information about clinicians serving in the NHSC's joint state-federal funded State Loan Repayment Program; hence, these several hundred clinicians are not included in this report.14
The file we received contained an indicator of the program in which each clinician was serving (Scholarship vs Loan Repayment), information about clinicians' clinical disciplines and specialties, and location information for each clinician's principal site of service as of the last date of each quarter, including city, state, ZIP code, and a rural/urban indicator. The file contained information for 68,662 clinician-quarters for 10,886 distinct clinicians.
Because the rural-urban indicator in the BMISS database is based on self-reported information provided by clinic staff when they apply to be designated as an NHSC site, we assessed it against a more uniform and accepted subcounty rural-urban classification, specifically, the ZIP code approximation of census tract–based Rural-Urban Commuting Area (RUCA) codes dichotomized in standard fashion to urban (codes 1 to 3) and rural (codes 4 to 10) areas.21,22 For sites located within the continental United States and Hawaii, rural/urban classifications based on RUCA codes and sites' self-reports differed for 23.0% of clinician-quarters, with self-reports yielding approximately 23% higher rural site proportions overall. We used the RUCA-based rural-urban classification in all analyses except for the 447 clinician-quarters in which clinicians were serving in American territories, for which RUCA codes are unavailable.
Analysis
Because the NHSC assigned clinicians to either Recovery Act or regular annual appropriation funds without regard to characteristics of clinicians or sites (ie, the funds are used interchangeably), we included both groups in our analyses. Analyses are descriptive, characterizing NHSC clinician numbers in the Loan Repayment and Scholarship Programs and within individual and groups of disciplines both before and after the Recovery Act period.
Numbers of NHSC clinicians in rural and urban areas before and after Recovery Act funding are presented using the ZIP code–based RUCA rural-urban classification. We describe the variation in numbers of NHSC clinicians across states before Recovery act funding, as well as the variation in growth of NHSC clinicians across states over the 2-year Recovery Act period. We normalized state differences in NHSC clinician numbers by assessing them against the number of individuals living below the federal poverty level in each state.23
Analyses were conducted using SPSS Statistics version 18.0 (IBM, Somers, NY) and Microsoft Excel 2010 (Redmond, WA). This study was approved by the Public Health Nursing Institutional Review Board of the University of North Carolina at Chapel Hill on February 17, 2011.
Results
Growth of the NHSC Workforce
The NHSC's overall workforce remained essentially unchanged in size during the 18 months before March 2009, the start of Recovery Act period, but from then on numbers steadily increased (Figure 1). From March 2009 through February 2011, numbers of total clinicians serving in the NHSC rose from 3017 to 7713, an increase of 4696 clinicians, or a 156% gain (Table 1).

Growth in the National Health Service Corps' active clinician workforce in the Loan Repayment and Scholarship Programs, September 2007 through February 2011. (Data from the US Bureau of Clinician Recruitment and Service's Management Information System Solution.)
The entire growth in the NHSC's overall workforce from March 2009 to February 2011 was because of growth in its Loan Repayment Program, which grew 191% (Table 1). Numbers of clinicians serving in the Scholarship Program's workforce remained essentially unchanged during the Recovery Act period; its expanded student numbers under Recovery Act support will not enter the NHSC's clinician workforce until after these students graduate in coming years.
Changes in Discipline and Specialty Composition
Loan Repayment Program
Numbers in the Loan Repayment Program's primary care, mental health, and dental health disciplines all roughly doubled during the Recovery Act period, so there was little change in the relative proportions of the 3 within the program: 58% primary care, 28% mental health, and 14% dental health (Table 1). However, within the primary care group, physician numbers grew far less (114%) over the 2-year period than did the growth in nurse practitioners (367%), physician assistants (199%), and nurse midwives (175%). Physicians' proportion of all loan repayers dropped from 31.3% to 23.1%. Among mental health disciplines, growth was greatest for licensed professional counselors (389%), and among the NHSC's larger mental health groups, growth was least for clinical psychologists (129%).
Scholarship Program
Within the essentially unchanged size of the Scholarship Program workforce, there was moderate growth in dentist numbers (20%), negligible growth in physician numbers (1%), and a one-third or greater decrease in numbers of physician assistants, nurse practitioners, and certified nurse midwives (Table 1).
NHSC's Overall Workforce
Primary care clinicians increased from 1928 to 4544 in number but their proportion of all NHSC clinicians decreased, from 63.9% to 58.9% (Figure 2; Table 1). The mental health component of the NHSC's workforce grew fastest proportionately, from 684 to 2117 clinicians, thereby increasing from 22.7% to 27.4% of the NHSC's total workforce. The dental health component of the NHSC's overall clinician workforce changed only slightly, from 13.4% to 13.6%.
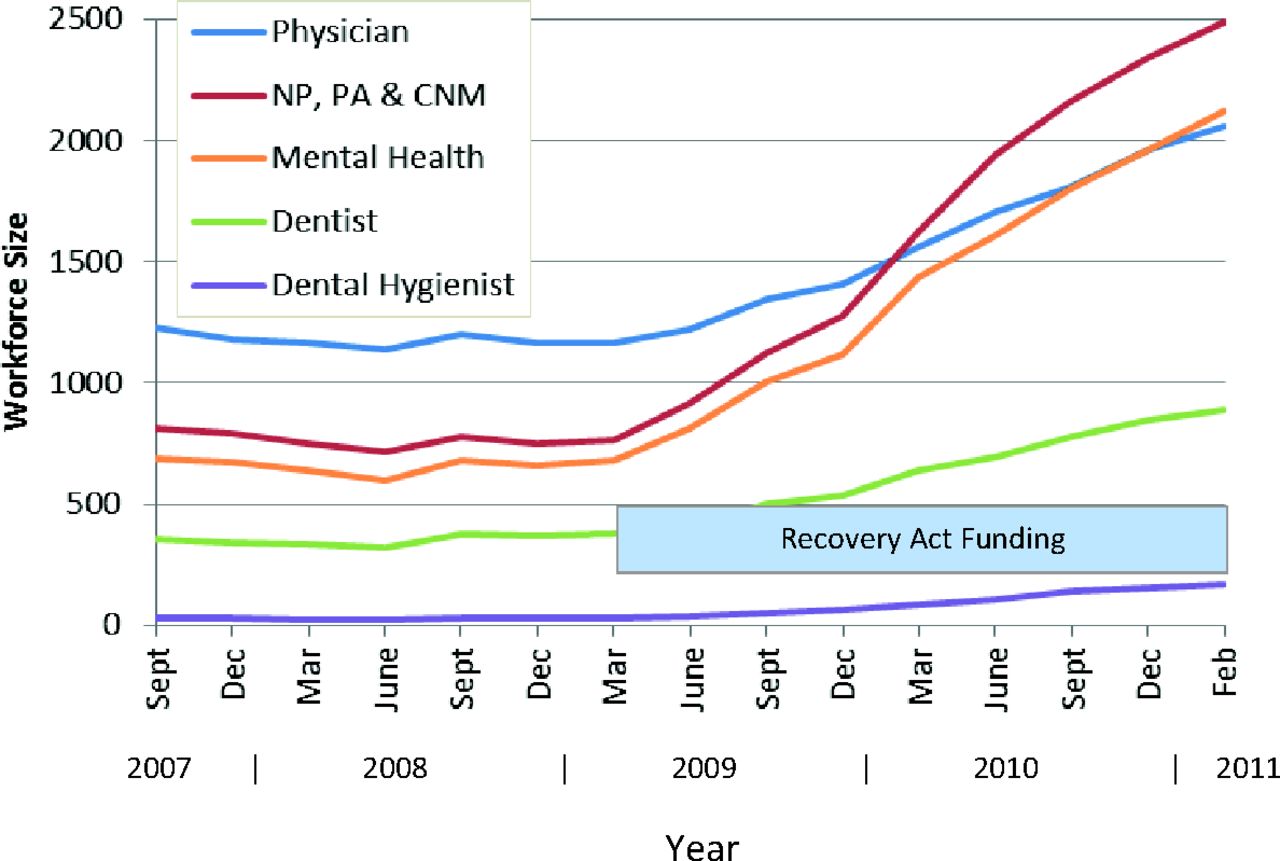
Growth in the National Health Service Corps' active clinician workforce by discipline group, September 2007 through February 2011. NP, nurse practitioner; PA, physician assistant; CNM, certified nurse midwife. (Data from the US Bureau of Clinician Recruitment and Service's Management Information System Solution.)
Among individual disciplines, physicians decreased most as a component of the NHSC's overall workforce, dropping from 38.6% to 26.7%. Greatest growth was seen in nurse practitioners, who increased from 10.1% to 16.0% of all NHSC clinicians.
The relative numbers among the NHSC's 5 eligible physician specialties did not change significantly from March 2009 to February 2011. The percentage of all physicians who were family physicians changed from 53.4% to 56.0%; pediatricians changed from 16.2% to 16.6%; general internists changed from 12.9% to 10.7%; obstetrician/gynecologists changed from 10.3% to 9.1%; and psychiatrists changed from 7.2% to 7.5%.
Changes in Rural-Urban Distribution
The Recovery Act period saw little change in the rural versus urban distribution of the NHSC's workforce. Before the Recovery Act period, 1349 of the NHSC's 3017 clinicians (44.7%) were serving in rural areas as defined by the RUCA classification, and as of February 2011, 3236 of 7713 clinicians (42.0%) were serving in rural areas. Similarly, the proportion of NHSC clinicians that worked in the very smallest towns—those with a population <2500 (RUCA codes 7 through 10)—decreased modestly from 27.0% (810 of 2999) to 23.5% (1807 of 7676).
Changes in State Location
Before the Recovery Act, the number of NHSC clinicians who were serving in each state varied by more than 100-fold (Table 2). With Recovery Act funding, NHSC clinician numbers increased within every state, but the percentage of growth varied significantly across states (Table 2, Figure 3).
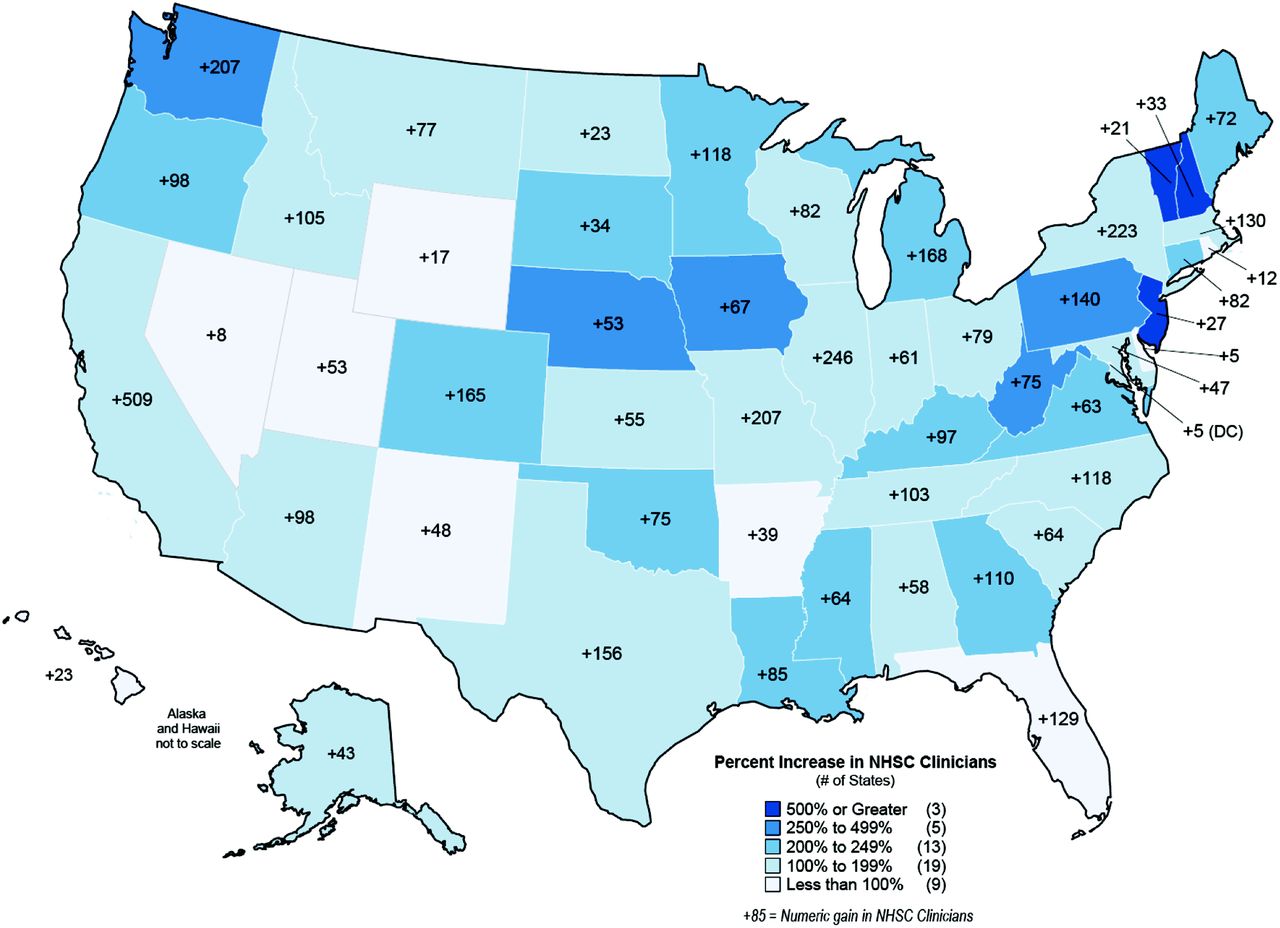
Map of percentage and numerical growth in National Health Service Corps' clinicians in each US state during the American Recovery and Reinvestment Act funding period, March 2009 through February 2011. (Data from the US Bureau of Clinician Recruitment and Service's Management Information System Solution.)
At the beginning of the Recovery Act period, states also varied greatly in their numbers of NHSC clinicians relative to the size of their poor populations, with rates varying from 0.63 to 62.9 NHSC clinicians per 100,000 people in poverty (Table 3). We sorted states into lowest to highest quartiles in terms of their pre–Recovery Act numbers of NHSC clinicians per 100,000 population below poverty and found that growth in NHSC clinician numbers was 291% in states with the fewest NHSC clinicians per 100,000 people below poverty before the Recovery Act versus a more modest 111% growth in states with the most NHSC clinicians per 100,000 people below poverty initially (Table 3).
As of March 2009 and before Recovery Act growth, primary care clinicians were the largest component of the NHSC's workforce in all states except Minnesota and Wyoming, where they were outnumbered by mental health clinicians. As of February 2011, mental health clinicians outnumbered primary care clinicians in 6 states.
Discussion
Through the Recovery Act, the NHSC workforce grew to 2.5 times its prior size to 7713 clinicians and became far larger than it ever had been. It is estimated that the number of people receiving care each year from NHSC clinicians increased from 4 million to 9 million during this period.24 Nevertheless, even when the NHSC reached more than 10,000 clinicians in 2011 with additional Affordable Care Act funding,19 its workforce still met less than one third of the need for clinicians in HPSAs, estimated at 34,000 as of mid-2011.25
The NHSC responded quickly and successfully to make more than 4000 new awards with Recovery Act funds. Its growth was assisted by expanded program flexibility from Congress,13,26 guidance from its National Advisory Council and others,26 and the recruitment efforts of states' primary care offices and other recruiters.24⇓⇓⇓–28 The Loan Repayment Program added a long-sought half-time service option and increased maximum loan repayment amounts.12,23,29 NHSC Regional Office staff now make routine visits to NHSC sites.30 Faced with the challenge and opportunity of rapid expansion, the NHSC is building the culture and system of supports required for a large, nationally dispersed, and diverse workforce of over 10,000 young clinicians.
The clinician composition of the NHSC's workforce changed during its Recovery Act growth. Primary care's contribution decreased from 64% to 59%, specifically because physician growth did not keep pace with other health professions. Physicians' contribution to the NHSC's overall workforce was more than 50% in the late 1990s6 and had decreased to 39% by March 2009, then decreased further, to 27%, by February 2011 to become a smaller part of the NHSC's workforce than at any point in its history.
As of 2000, fewer than 200 mental health professionals were serving in the NHSC.12 After deliberate efforts to diversify the NHSC's workforce, mental health clinicians had grown to 23% of the NHSC's workforce by March 2009 and then grew to 27% during the Recovery Act period. The dental component of the NHSC workforce remained unchanged (at about 14%) during the Recovery Act years.
The NHSC's priority during the Recovery Act period was to recruit clinicians quickly to build the size of its workforce. No specific goals were set for the relative size of the NHSC's primary care, mental health, and dental health components or for specific disciplines. Growth for each discipline occurred independently and resulted from how appealing its clinicians found the NHSC's expanded loan repayment opportunities and available practice sites. We note that response was more vigorous from disciplines with lower average incomes, including licensed professional counselors among mental health practitioners, dental hygienists among dental health practitioners, and nurse practitioners among primary care practitioners. For these disciplines, $50,000 in loan repayment for an initial 2-year commitment means more and is a stronger enticement than it is for higher-income clinical psychologists, dentists, and physicians, who responded well, but not as well, in the NHSC's expansion.
With a still great unmet need for clinicians of all fields within HPSAs, any and all growth of any of the NHSC's disciplines is a good thing. Nevertheless, growth for such an important health workforce program should be guided by some notion of size targets for its various participating disciplines. For a program that views population health needs broadly and values interdisciplinary care, there may be no simple or noncontentious way to set size targets for individual or groups of disciplines. One reasonable approach would be to give preference to disciplines that are hardest to recruit into needy areas without external incentives.31 Another reasonable approach is to target disciplines that demonstrate best outcomes with loan repayment and scholarships, such as longest retention. Another advocated approach is to aim for a balanced workforce that meets the same percentage of the estimated shortage for clinicians within primary care, dental health, and mental health HPSAs.12 With 7713 clinicians able to provide 22.8% of the 33,759 clinicians of all types needed within HPSAs as of early May 2011,25 a balanced allocation would have the NHSC meet 22.8% of the 17,588 clinician shortages in primary care HPSAs, 22.8% of the 6142 clinician shortages in mental health HPSAs, and 22.8% of the 10,029 clinician shortages in dental HPSAs. Against these numbers, the NHSC workforce after the Recovery Act period has 54% too few dental health clinicians, 51% too many mental health clinicians, and 13% too many primary care clinicians.
In the fall of 2010, the NHSC announced an increase in the maximum loan repayment amount for all disciplines, from $50,000 to $60,000 for an initial 2-year contract.1 If a goal was set to increase the numbers of dentists, physicians, other specific disciplines, or all three, then it would be preferable to selectively increase loan repayment amounts for these groups only. Such a 2-tier loan repayment amount structure is used by the loan repayment programs of some states.32,33
Able to place more clinicians with its Recovery Act dollars, the NHSC no longer needed to set a HPSA score floor requirement and therefore made clinics in all HPSAs eligible to apply to become NHSC sites. This led to roughly a doubling of NHSC sites to more than 10,000.18 Despite this expansion of service site opportunities, we found only modest changes in the rural-urban balance of the NHSC's workforce during the Recovery Act period, with the rural proportion decreasing from 44.7% to 42.0%. But with more than 50% of the clinician shortages in primary care, dental, and mental health HPSAs being within rural areas,25 it seems that the NHSC's workforce remains somewhat over-allocated to urban settings. The NHSC relies on clinics' self-designations of their rural versus urban location and therefore views its workforce as being slightly more than half rural.34 Clinics' self-designations may, in fact, better reflect the “ruralness” of their settings than official, standardized rural-urban designations. But the opposite also could be true, and self-designations are surely less uniform. The rural-urban distribution of the NHSC's workforce deserves further reevaluation so that it can be accurately and confidently understood and, if needed, adjusted in the future.
More significant were the changes in the states where NHSC clinicians were serving. Recovery Act growth yielded a more even distribution of NHSC clinicians across states relative to their need. We suspect this was a positive consequence of the elimination of the HPSA score threshold for site eligibility, which had previously disadvantaged some states whose needy populations were constituted and distributed in ways that yielded lower HPSA scores based on the one-size-fits-all HPSA formula.
Limitations
Our documented 2474 loan repayors and 543 Scholars in the NHSC as of February 2009 are similar to the numbers reported by HRSA for early June 200935 but are somewhat fewer than figures before the Recovery Act reported elsewhere.36 Figures from these various sources differ from each other and from the numbers we report because calculations for each are for somewhat different dates, rely on somewhat different data sources, and sometimes track different clinician groups (eg, only some include participants of the NHSC's State Loan Repayment Program).
We reported psychiatrists and psychiatric nurse practitioners within the primary care component of the NHSC's workforce. If instead we had included them as mental health practitioners, the size of the NHSC's mental health component would have been calculated larger and its primary care component smaller.
This study documents only the effects of Recovery Act funds on the NHSC's workforce during the initial 2 years when funds were allocated. Many of the more than 4000 clinicians awarded Loan Repayment with Recovery Act funds will continue to contribute to NHSC workforce figures through 2012 and early 2013, and some of the 255 students awarded scholarships with Recovery Act funds will remain in the NHSC's workforce through as late as 2021. Furthermore, the figures we report do not include the estimated 330 clinicians awarded loan repayment with Recovery Act funds through states' NHSC State Loan Repayment Programs.14
Conclusions
Educational scholarship and loan repayment incentives cannot, on their own, completely right the maldistribution of the US health care workforce when there are nationwide shortages for most disciplines and many attractive job and salary opportunities available in nonunderserved areas. Nevertheless, Recovery Act funding has enabled the NHSC to now deploy a workforce of sufficient size and disciplinary diversity to make a sizable dent in the clinician needs of shortage areas.
Having updated its programs and operations and having successfully weathered the turbulence of rapid growth, the NHSC is now well constituted to face the demands of managing its larger workforce. But with more efficient operations and a record number of clinician applicants this year, it is important now for the NHSC to strategically target its allocation of new awards so that its workforce is constituted to make the greatest possible contribution to health and health care access in needy communities. This will require setting targets for the disciplinary composition and location of the NHSC workforce and then adjusting outreach activities, contract terms and incentives, and clinician and site selection criteria to favor targeted disciplines and communities. In the current 2012 Loan Repayment application cycle, the NHSC for the first time tiered its payment amounts to incentivize sites with higher HPSA scores.37 The NHSC should consider similarly tiering its payment amounts to proportionally reflect the sizable differences in disciplines' debts and incomes and to incent disciplines that are falling shortest of communities' and the NHSC's recruitment targets.
Acknowledgments
The authors thank Ms. Katie Gaul at the University of North Carolina's Cecil G. Sheps Center for Health Services Research for creating this article's map.
Notes
This article was externally peer reviewed.
Funding: none.
Conflict of interest: DEP serves on the NHSC's National Advisory Board, but this work was completed independently and does not necessarily reflect the views of the Board or the NHSC.
- Received for publication September 5, 2011.
- Revision received May 24, 2012.
- Accepted for publication May 29, 2012.
In this issue


Jump to section
Related Articles
Cited By...
- Outcomes of States Loan Repayment and Forgiveness Programs From the Perspective of Safety Net Practice Administrators
- Outcomes of States Loan Repayment and Forgiveness Programs From the Perspective of Safety Net Practice Administrators
- Changes in Rates and Content of Primary Care Visits Within an Evolving Health Care System
- Building The Mental Health Workforce Capacity Needed To Treat Adults With Serious Mental Illnesses
- Barriers and Potential Solutions to Providing Optimal Guideline-Driven Care to Patients With Diabetes in the U.S.
- Primary Care Research Conducted in Networks: Getting Down to Business