
Abstract
Introduction: This study examined barriers to colorectal cancer (CRC) screening in people living in rural areas.
Methods: We identified 2 rural counties with high rates of CRC and randomly contacted county residents by telephone using a published listing.
Results: Six hundred thirty-five of the 1839 eligible respondents (34.5%) between the ages of 50 and 79 years living in McDuffie and Screven counties, Georgia, agreed to complete the survey. The mean age was 62.2 years (SD, ±7.5 years); 72.4% were women, 79.4% were white, and 19.5% were African American. African-American respondents had lower CRC screening rates (50.4%) than whites (63.4%; P = .009). Significantly more African Americans compared with whites reported barriers to CRC screening. Based on logistic regression analyses, having a physician recommend CRC screening had the strongest association with having a current CRC screening, regardless of race.
Conclusions: Important racial differences existed between African Americans and whites regarding the barriers to CRC screening and factors impacting current screening. However, endorsement of a small set of questionnaire items—not race—had the strongest association with being current with screening. Physician recommendation for CRC screening had the strongest association with being current with CRC screening.
Colorectal cancer (CRC) is the third most commonly diagnosed cancer in the United States.1 In 2010, an estimated 142,570 Americans were diagnosed with CRC, and approximately 51,370 died from this disease.1 All CRC screening guidelines recommend screening patients 50 years of age and older. Options for CRC screening include fecal occult blood tests (FOBTs), flexible sigmoidoscopy, double-contrast barium enema, computed tomography colonography, and colonoscopy.2⇓–4 Recent evidence suggests that improving CRC screening rates may reduce the societal burden and cost associated with the treatment of CRC by preventing some cancers and by diagnosing cancer at an earlier stage than would have been detected if screening had not occurred.
Because 80% of CRC occurs in individuals without identifiable risk factors, CRC screening targets average-risk individuals.2 Costs associated with CRC screening are an important barrier to completing screening tests. In addition, health insurance is an important determinant of completed cancer screening independent of other factors, including demographics and chronic health conditions.5 Minority populations and low socioeconomic status are 2 risk factors for low rates of CRC screening and, therefore, increased risk for CRC.6⇓–8 African Americans have a 20% higher incidence for CRC and 45% higher mortality from CRC than whites.9 The National Health Interview Survey reported that racial disparities seen with CRC screening are related to socioeconomic status,10 however, racial disparities persist despite coverage for CRC screening in a Medicare population.11
Several studies have found consistently lower screening rates in rural versus nonrural areas.12⇓–16 Only one study, by Greiner et al,14 focused on barriers to CRC screening among patients seeking care in a primary care physician's office in rural areas and found that screening in rural areas was not associated with the availability of endoscopic procedures or access to a gastroenterologist but was associated with physician discussions of CRC. In a study of 931 women aged 50 to 80 years, physician recommendation was strongly associated with a completed FOBT (odds ratio, 16.7).17 Even with a physician recommendation, adherence rates for CRC screening are low (10% to 50%) and vary with the particular screening test recommended.18 The purpose of our study was to examine CRC screening rates and barriers to CRC screening in a rural population.
Methods
Subject Population
We initially determined CRC incidence and mortality data for Georgia counties through Oasis, which is a state-run health data mapping tool. Two rural counties, McDuffie and Screven, with higher incidence and mortality rates for CRC compared with the rest of the state were selected. McDuffie County has an estimated population of 21,917 persons; 12.1% of the population is 65 years of age or older, 52.7% are women, 60.4% are white, 38.1% are African American, and 1.4% are other races. Screven County has an estimated population of 15,190 persons; 14.4% of the population is 65 years of age or older, 51.6% are women, 54.7% are white, 44.2% are African American, and 1.1% are other races. The median household income in McDuffie County is $33,185 compared with $29,029 in Screven County; both are less than the $42,679 average in Georgia. The poverty rate is 17.8% in McDuffie County, 19.5% in Screven County, and 13.7% in Georgia. McDuffie and Screven counties have higher death rates (53.7 per 100,000 and 80.8 per 100,000, respectively) from CRC compared with those for the state of Georgia (44.2 per 100,000).19
Residential landline telephone listings were obtained and preselected for households with a member aged 50 to 79 years. The telephone listings were stratified by county and then arranged in random order. Of a list consisting of 4461 potential respondents, we called every 10th telephone number. If no one answered, the next number on the list was called. All calls were made between 5 and 8 pm on weekdays. Telephone calls were completed over a 6-week period by 5 temporary employees (medical students) hired to conduct this survey. All interviewers received 2 hours of training, which included a formal didactic presentation about telephone interviewing techniques, form completion, and our structured telephone interview protocol. All interviewers practiced telephone interviews before beginning data collection. Telephone calls were monitored on a weekly basis by investigators for quality control.
Potential respondents were contacted by telephone and screened for eligibility by confirming that they were between the ages of 50 and 79 years. If someone younger than 50 answered the telephone, we asked to speak to someone who was between the ages of 50 to 79. Once eligibility was confirmed, we presented a consent statement briefing the respondents on the nature of the questions being asked and reinforcing that participation was voluntary. No subject incentive was provided for completing the telephone survey. Institutional review board approval was obtained for this study before any respondents were contacted.
Telephone Survey Instrument
We modified previously validated survey instruments based on the Health Belief Model to assess benefits and barriers to CRC screening.20,21 The resulting survey has well-established psychometric properties for (1) benefit items for all screening tests (n = 5 items); (2) barrier items for all screening tests (n = 6 items); (3) barrier items specific for FOBT (n = 3); (4) barrier items specific to flexible sigmoidoscopy and colonoscopy (n = 3); and (5) barrier items for colonoscopy alone (n = 2). Perceived risk and worry regarding colon cancer were assessed with single items.22 The first part of the survey assessed demographic information including age, sex, and race. Subjects were asked about barriers to completing CRC screening tests and if they had ever completed a FOBT, flexible sigmoidoscopy, or colonoscopy. The second part of the survey assessed perceived benefits to CRC screening, additional demographic factors (eg, marital status, education, and insurance coverage), and social influences on CRC screening.
Statistical Analysis
Descriptive analyses, χ2 tests, and t tests were completed for demographic items. Cronbach α was used to measure internal consistency of barriers and benefits scales and subscales. χ2 or t tests were completed to analyze CRC knowledge and attitudinal items to examine differences between respondents who were current or not current with CRC screening. Perceived barriers and benefits to each screening test and overall CRC screening were analyzed using χ2 tests to compare groups defined by current screening status, race, and education level. Step-wise variable selection, backward elimination, and best subsets logistic regression (LR) were used to identify potential LR models for further consideration. Diagnostic criteria for LR models (Hosmer-Lemeshow test, generalized R2, etc.) were used to assess the goodness of fit of the various models that were considered. Each variable selection method was applied to several collections of potential explanatory variables (demographic and medical characteristics only, demographic and medical characteristics plus benefits scale and barrier scale scores, demographic and medical characteristics plus benefits and barriers scale items, etc.) and the best-fitting LR model from each collection was retained, provided it was satisfactory according to the LR diagnostic criteria. As is typically done, the variable selection procedures were performed using only those subjects who had complete data for all explanatory variables being considered for inclusion in the particular LR model. Once the variable selection process was completed, the LR model was estimated using all subjects with complete data for the selected explanatory variables. The LR model that performed best overall in terms of the statistical criteria and was considered to be the most useful model clinically was selected as the “final” retained LR model. Receiver operating characteristic (ROC) curve analysis was used to determine the final model's ability to accurately discriminate between patients who were current with their CRC screening and those who were not. Data were analyzed using SPSS (version 16.0, IBM, Chicago, IL) and SAS (version 9.2, SAS Institute Inc., Cary, NC) software.
Results
Respondent Demographics
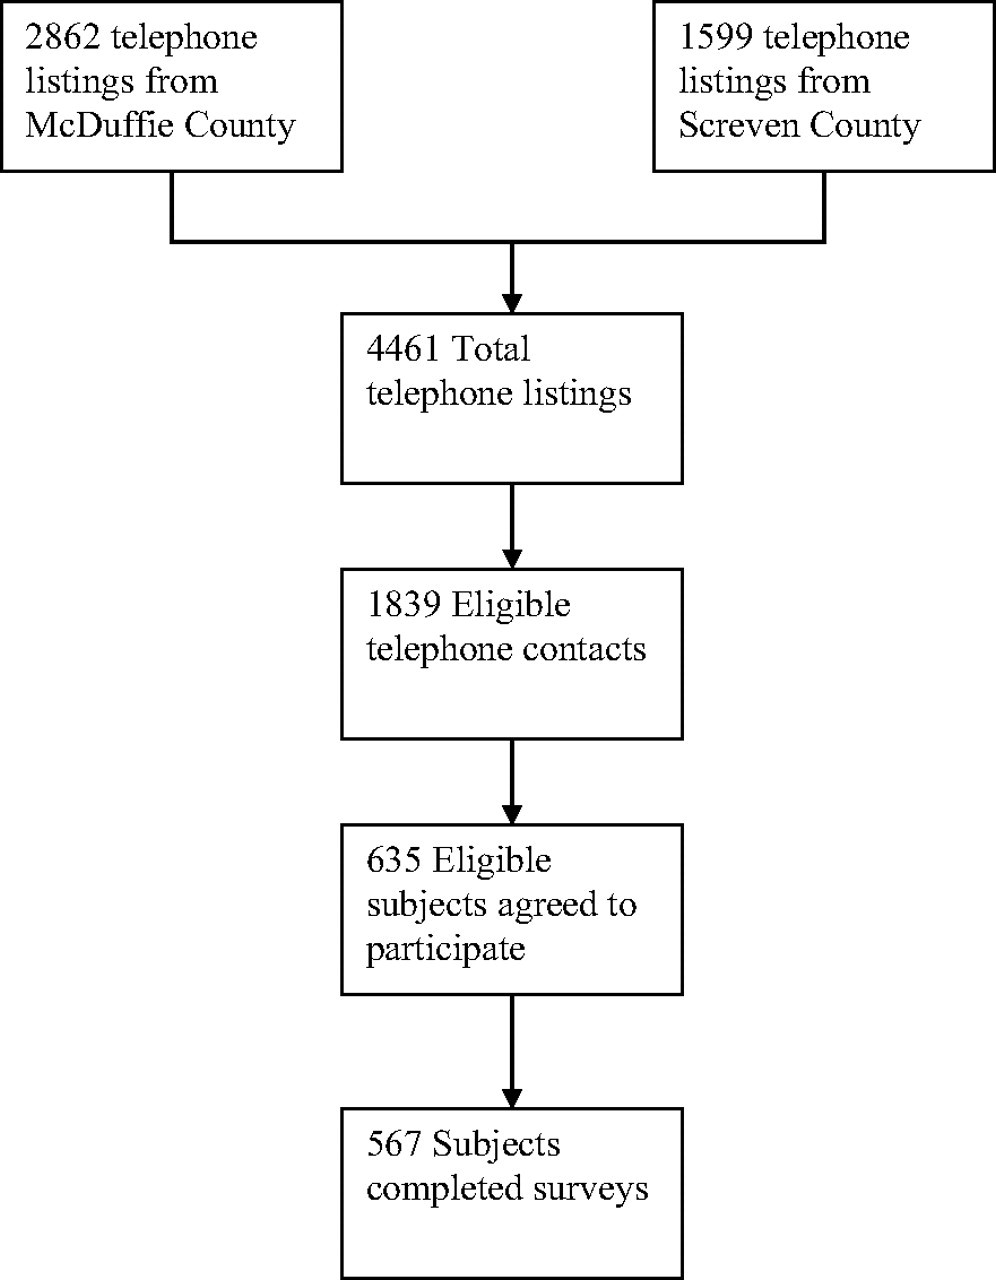
From a list of 4461 potential respondents, 1839 eligible telephone numbers in 2 rural Georgian counties were called for this study, and 635 respondents (34.5% acceptance rate) agreed to participate (see Figure 1). The mean age of respondents was 62.2 years (standard deviation, ±7.5), and 72.4% were women. The majority of respondents (79.4%) were white, and 19.5% were African American. Most respondents (64.2%) were married or a member of an unmarried couple. Forty percent of respondents had attained a high school diploma or GED certificate, and 40.8% completed college or had some college education.

Subject flow diagram.
Three hundred eighty-two respondents (60.2%) had current CRC screening defined as a FOBT within 1 year, a flexible sigmoidoscopy within 5 years, or a colonoscopy within 10 years. In analyses, “current with CRC screening” indicates the respondent has a current CRC screening status with at least one of the CRC screening types; this is a categorical variable (yes/no). Slightly fewer respondents in McDuffie County were current with CRC screening than in Screven County (57.2% vs 65.6%, respectively; P = .036). Older respondents (70–79 years of age) were more likely than younger respondents (50- 59 years of age) to have current screenings (P = .002). There were no differences in screening rates between male and female respondents (P = .779). Other factors associated with higher current screening rates included having insurance (P < .001), having a personal doctor (P < .001), personally knowing someone with CRC (P = .003), having graduated from college (P = .005), having an immediate family member with CRC (P = .006), and having a higher perceived risk of developing CRC (P = .015). See Table 1 for a summary of respondent characteristics and CRC screening status.
A higher percentage of whites reported having current CRC screening compared with African Americans (63.4% vs 50.4%, respectively; P = .009). Additional racial demographics may provide context for the significant screening status by race finding. A greater proportion of African Americans had less than a high school education than did whites (43.9% vs 13.1%, respectively; P < .001), and a larger percentage of African Americans were uninsured compared with whites (16.3% vs 10.2%, respectively; P = .08). A slightly higher percentage of whites were in the 70- to 79-year-old age category than African Americans (20.8 vs 13.7%, respectively; P = .14). Of the respondents with current screening (n = 382), 44.0% had a current FOBT, 38.7% had a current flexible sigmoidoscopy, and 77.0% a current colonoscopy (sum is >100% because some respondents have had more than 1 test). Table 2 shows a summary of currently screened respondents by test type, race, sex, and age. There were no racial disparities between whites and African Americans for current screening with FOBT (26.7% vs 25.6; P = .81) or flexible sigmoidoscopy (25.3% vs 19.0%; P = .15), but whites were far more likely than African Americans to have a current colonoscopy screening (51.0% vs 29.8%; P < .001).
CRC Screening Among Respondents
The majority of respondents had heard of the 3 common screening tests; colonoscopy was the most recognized test (90.9%), followed by FOBT (78.9%), and then flexible sigmoidoscopy (61.4%). Sixty-nine percent of subjects had completed a FOBT; 54.4% had completed a flexible sigmoidoscopy, and 56.4% had completed a colonoscopy.
Perceived Barriers and Benefits to CRC Screening
The 17 items assessing respondents' perceived barriers to specific CRC screening tests and CRC screening in general yielded a relatively high Cronbach α coefficient (0.81). Removal of any of the items did not significantly improve reliability of the items. The 5 colonoscopy items had the highest subscale Cronbach α (0.74), followed by the 3 FOBT items (0.45), the 3 flexible sigmoidoscopy items (0.44), and the 6 general barriers to CRC screening (0.43). The 5 items assessing perceived benefits for CRC screenings yielded a strong Cronbach α coefficient (0.81), with no items improving reliability if removed.
African-American respondents indicated greater agreement with 2 general CRC barriers than did white respondents (insufficient time with a physician, P = .018, and high screening cost, P = .005), whereas white respondents reported greater embarrassment with screenings (P = .005). African Americans indicated greater uncertainty with how to complete FOBT (P < .001) and greater concern about privacy to collect samples (P < .001). For flexible sigmoidoscopy, African Americans indicated more concern about bowel preparation (P < .001) and anxiety about what was actually done during the procedure (P = .050). For colonoscopy, African Americans rated all 5 of the barrier items (anxious because they did not understand the procedure, afraid of complication, preparation, transportation, and anticipated pain with colonoscopy) significantly higher than whites (P = .003). For perceived benefits, whites agreed more than African Americans with 2 benefit items: finding CRC early decreases chances from dying from it (P = .002) and screening decreases their worry (P = .004). Respondents who had a higher educational level consistently reported fewer barriers than respondents with lower educational levels. Table 3 shows a summary of perceived barriers and benefits by current screening status, race, and education.
Respondents who had a current screening on at least one of the 3 CRC tests consistently endorsed less agreement with barriers to completing a CRC screening and greater agreement with perceived benefits of screening than respondents not current with screening. Most of the barrier items were significant at P ≤ .001 except 2 items that were significant to a lesser degree or not significant: embarrassment with CRC screening and collecting FOBT is unpleasant (P = .033 and not significant, respectively). For perceived benefits of screening, respondents with current screening consistently endorsed benefits more strongly than respondents who were not current with screening.
Odds ratios were used to examine the association between explanatory variables (demographic and medical characteristics, social influences and support items, barriers items, benefits items, total barriers and benefits scale scores, etc.) and dichotomous outcome (current CRC screening vs not current). All explanatory variables that were significant at the 0.05 level individually were entered into a variable selection process for LR analysis, similar to that described by Hosmer and Lemeshow,23 to identify the most parsimonious subset of explanatory variables.
The variable selection process retained 4 of the explanatory variables in the final LR model: 2 barrier items (“My physician has spent enough time discussing colorectal cancer and the screening tests” and “You do not need to do a screening test for colorectal cancer because you have no problems”), one benefit item (“A screening test will decrease your chances of dying from colorectal cancer”), and one social influences and support item (“Has anyone in your immediate family had colorectal cancer?”). The parameters of the fitted model, along with the estimated odds ratio for each retained explanatory variable, are given in Table 4. This model was based on a sample size of n = 477 out of the original sample size of 635. The Hosmer-Lemeshow test indicated adequate goodness-of-fit of this model (P = .540) and the generalized R2 value of 0.250 was the best among the 5 candidates for best model. The area under the ROC curve for this LR model was 0.76.
To examine how well the final LR model could be used as a screening tool to identify patients who are not current with their CRC screening and thus are indicated for additional intervention to encourage them to become current, we developed a “risk score” for each participant in our study based on their estimated probability of not being current with CRC screening, calculated using the estimated model coefficients presented in Table 4. Any patient whose risk score is 0.380 or more would be classified as likely to be not current with CRC screening and hence in need of intervention. This cutoff point yielded an estimated sensitivity of 68%. Any patient whose risk score was less than 0.380 would be classified as likely to be current with CRC screening and not in need of intervention, yielding an estimated specificity of 74%. Using the 0.380 cutoff point, the estimated total percent correctly classified was 72%.
Discussion
Within our study of 2 rural Georgia counties (McDuffie and Screven), we had an average completion rate (34.5%) of our telephone survey. Sixty percent of respondents reported they had completed CRC screening. This relatively high screening rate was unexpected in these 2 rural counties, but callers who had been screened previously may have been more willing to complete our telephone survey, thereby introducing selection bias into our sample. Older persons within the age range of our sample were more likely to have completed CRC screening compared with younger persons. This may reflect a greater frequency of physician visits or that older patients had Medicare and less out-of-pocket medical expenses compared with younger patients who were without insurance, were underinsured, or had high copayments.
We found significant racial differences in overall screening rates in whites versus African Americans and in the types of screening tests completed. Whites reported current CRC screening more often and were more likely to have completed a colonoscopy than African Americans, whereas African Americans were more likely to have completed FOBT. We hypothesize that these differences may be accounted for by socioeconomic status, which would be supported by previous CRC literature. In addition, physician recommendation is more important for African Americans than for whites, which confirms that a physician recommendation is an important factor for persons completing CRC screening.14,17,18 Compared with white respondents, African Americans also were more likely to report the following barriers to screening: perceived barriers of physician time, screening cost being high, and screening being embarrassing.
In general, the 2 rural counties that we studied have a higher poverty rate, lower educational level, more limited access to health professionals, and less coverage by health insurance compared with other counties in Georgia. Several studies have looked at the barriers to and potential benefits of reaching out to lower socioeconomic status populations for CRC screening. A recent systematic review reported that lower socioeconomic status was correlated with a higher incidence and mortality rate from CRC within the United States and Canada.8 In a qualitative study, lower socioeconomic status respondents expressed that a major barrier to CRC screening was the quality of care (eg, the perceived lack of screening being offered and the follow-up of test results).24 In addition, a study of 5978 patients found significant racial and socioeconomic status differences in cancer screening discussions, including those for CRC screening.25
In an exploratory, follow-up analysis of the LR results, the ROC curve analysis completed in this study suggests a potentially useful method for assessing and addressing CRC screening status with patients. Patients who endorse “insufficient physician time,” “no problems related to CRC,” and “immediate family had CRC” and who fail to endorse “screening test decreases chances of dying from CRC” are less likely to have current CRC screening. Using a cutoff point of 0.380 for the “risk score” based on a patient's estimated probability of not being current with CRC screening yielded the best balance between sensitivity (probability of correctly identifying those not current with their CRC screening) and specificity (probability of correctly identifying those who are current with their CRC screening). These results are encouraging and suggest that this risk score should be evaluated more thoroughly in a future study as a possible screening tool for inadequate CRC screening in a general population. A potential by-product of this line of research would be a computer-based tool that would help physicians identify which of their patients who are not CRC screening current likely will need additional counseling to complete CRC screening.
Limitations
One limitation of our study is that we relied on self-reported survey data. We made no attempt to verify the accuracy of responses. We did not track information about respondents who did not complete the telephone survey. We did not assess health literacy, the last time the respondent was seen by a health care provider, or patients' proximity to a health care provider. Our sample included more women and whites, which may have introduced selection bias into our sample. Our survey asked about marital status at the time the survey was taken and not when the CRC screening test was completed.
Conclusions
Although the rate of respondents reporting that they were current with CRC screening was relatively high in our study, racial disparities existed in 2 rural counties in Georgia. African Americans are screened less often than whites and, when screened, are more likely to be screened with FOBT rather than flexible sigmoidoscopy or colonoscopy. Our study confirms that the most important factor for CRC screening is a recommendation from a personal physician, and this finding is more important among African-American patients.
Acknowledgments
We thank Stan Sulkowski, BS, for his assistance as the study coordinator.
Notes
This article was externally peer reviewed.
Funding: This research was made possible by an intramural grant from the Office of the Vice President for Research at the Medical College of Georgia.
Prior presentation: This work was presented at the North American Primary Care Research Group Annual Meeting, Vancouver, British Columbia, Canada, October 2007.
Conflict of interest: none declared.
- Received for publication December 31, 2010.
- Revision received October 28, 2011.
- Accepted for publication November 4, 2011.


