
Abstract
Objectives: We determined the frequencies of (1) female patients aged 65 years and older having bone density measurement performed and (2) prescription therapy use among osteoporotic women.
Methods: We completed a retrospective chart audit to assess our adherence to Physician Quality Reporting Initiative guidelines. Women aged 65 to 75 with an office visit between June 1 to November 30, 2007, were divided into 3 subgroups: those who had a recent preventive general medical examination (GME), those who received one in the last 10 years, and those who had not. We determined osteoporosis screening rates for all 3 groups. The first group then underwent electronic medical record review to obtain patient demographics, determine bone mineral density results, and review if those with osteoporosis were receiving prescription treatment.
Results: Ninety-six percent of 305 female patients seen for a GME during the study period had completed bone mineral density testing. This was a screening rate significantly greater than that for patients with an earlier GME and those who never had one in our offices (70% and 50%, respectively). Seventy-seven percent of recent GME patients had abnormal T scores. Low weight and body mass index were significantly associated with osteoporotic T scores. Seventy-four percent of patients whose latest T scores were less than −2.5 were receiving prescription therapy.
Conclusions: Female patients who completed a recent GME had extraordinarily high rates of screening for osteoporosis. We believe this demonstrates the importance of a dedicated preventive health examination as well as the increased significance that physicians and patients currently place on this behavior.
Primary care physicians have the opportunity to screen women for osteoporosis and intervene as indicated.1 The National Osteoporosis Foundation and the US Preventive Services Task Force agree that all women aged 65 years and older should be screened with bone mineral density testing.2,3 Although rates of screening seem to be increasing over time,4–6 there is still room for improvement.7 There have been calls for both family physicians8,9 and internists10 to take on greater responsibility for treatment and appropriate management of osteoporotic patients.
In this era of increasing regulation and oversight, pay-for-performance initiatives have been implemented by the Center for Medicare and Medicaid Services.11 Four areas of physician performance measures have been developed regarding osteoporosis management: (1) screening and therapy for osteoporosis among women 65 and older; (2) pharmacologic therapy for patients with a diagnosis of osteoporosis; (3) management after fracture; and (4) counseling about vitamin D, calcium intake, and exercise.
We were interested to know how our department was performing in terms of these osteoporosis behaviors and if there were areas in which to improve. This study reports findings from our retrospective chart review regarding the first 2 Physicians Quality Reporting Initiative (PQRI) objectives. The goals for this study were to determine (1) the percentage of female patients in this age group who had a bone mineral density (BMD) measurement performed at least once since age 60, and (2) the rate of prescription therapy use among osteoporotic women.
Method
Setting
Our department of family medicine had 2 clinical sites where 34 faculty and resident physicians cared for patients during the study period. Although we used an electronic medical record (EMR), it did not provide automated reminders or even a table delineating the latest date for provision of preventive services. We had, however, implemented the use of a “visit form” on which physicians could make notes during all clinical encounters about subjective complaints, physical examination findings, and other issues. This form included a list of common preventive services (eg, immunizations, mammography, colonoscopy, and bone density testing) and may have acted as a prompt to remind the physician to review these items with patients. Each facility had an onsite central dual-energy x-ray absorptiometry (DXA) scanner. Physicians were unaware that their osteoporosis screening behaviors would be examined because the genesis of this project occurred after the period of study was completed (ie, this was designed as a retrospective study). No special emphasis had been developed in our practice in regards to screening and prevention in general or for osteoporosis in particular. Our patient population is, however, made up of approximately 50% Medicare beneficiaries.
Patients and Selection
Female patients between the ages of 65 and 75 who had an office visit with a Mayo Clinic Arizona (MCA) Department of Family Medicine (DFM) physician in the 6-month period between June 2007 through November 2007 (as determined by billing data) were considered subjects for answering the objective regarding screening rates for osteoporosis.
Three subgroups were then created. First, those patients who had a general medical examination (GME) (also known as a preventive health examination [PHE]) with a MCA DFM physician from June 2007 through November 2007 were eligible to have their medical records reviewed to answer the secondary objective regarding treatment. Billing data were used to determine eligibility (by use of preventive services coding). These patients formed the “recent GME” group. We did not review charts for those women not seen recently for a GME.
Two groups were created for comparison of osteoporosis screening rates. Those who had a GME in the past 10 years (but not June 2007 through November 2007) were the “ever-GME” group. Those who had no preventive service code billed at MCA in the past 10 years were the “never GME” group.
Data Collection
Data were collected for the patients who had a recent GME through manual review of patients’ EMRs. The 2 groups created for comparison of osteoporosis screening rates did not have any chart review completed.
Patient Demographics/Characteristics
For the “recent GME” group, we determined and recorded each patient's age, smoking status, alcohol intake, weight, body mass index, current estrogen use (oral or transdermal), current use of chronic glucocorticoids, and whether each patient had been diagnosed previously with osteoporosis (either in the medical history of their visit dictation or on their problem list within the EMR.).
Physician Demographics/Characteristics
Previous studies have reported that female physicians and older physicians screened women for osteoporosis at higher rates then their male and younger counterparts.3,4,12 We categorized physicians based on physician sex and resident versus attending status (as a surrogate marker for physician age) to evaluate for potential differences in screening rates.
Osteoporosis Screening and Treatment
We reviewed records for the following issues: completion of BMD testing once or more since age 60 and the DXA scan results (spinal, hip, wrist T scores) for the most recent test result available (based on PQRI measure no. 39).11 In addition, we determined if the current medication list or GME documentation confirmed the use of prescription osteoporosis treatments (bisphosphonates, raloxifine, calcitonin, parathyroid hormone and estrogen treatments), based on PQRI measure no. 41.11
Power Analysis
If 200 charts were reviewed and a 50/50 split in physician sex or resident/attending status was found, we would have 80% power to detect a 20% difference in the screening behavior between groups. With 300 charts, that would allow for 80% power to detect a 15% difference in the screening behavior between groups.
Statistical Analysis Plan
We used descriptive statistics to report data (frequencies and relative frequencies for categorical data; means, standard deviations, medians, minimums, maximums, and ranges for continuous data). Associations between categorical variables were investigated via 2-way tables and associated χ2 tests. Associations between categorical variables and continuous variables were investigated via side-by-side box plots with analysis of variance techniques and pair-wise comparisons between groups (when multiple groups were being compared) or with 2-sample independent samples t tests (when 2 groups were being compared). Statistical significance was determined by a 2-sided P ≤ .05. This project was approved by the Mayo Foundation Institutional Review Board for human subject research.
Results
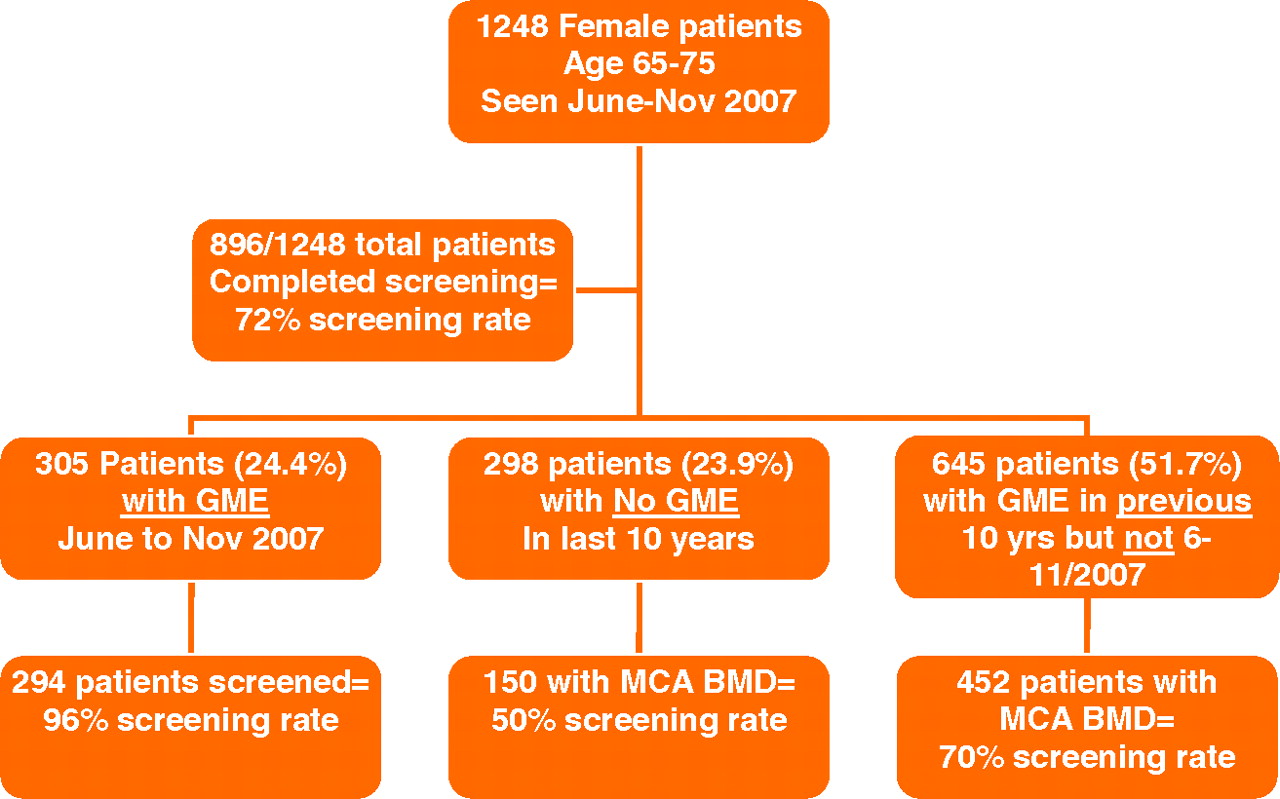
One thousand two hundred forty-eight female patients between the ages of 65 and 75 were seen by DFM physicians at MCA between June and November 2007. Three hundred five (24.4%) completed a GME during this time, as determined by billing data for a preventive service code. Six hundred forty-five (51.7%) of patients had completed a GME during the previous 10 years but not during our period of study. Two hundred ninety-eight patients (23.9%) had not been billed for a preventive service code within the proceeding 10 years.
Patient Attributes
Demographic characteristics of the 305 patients who were in the “recent GME” group are found in Table 1. Few patients were current smokers and most drank little to no alcohol. Eighty percent of these patients were seen by attending physicians for their GME visits and slightly more than half were seen by female physicians. One hundred seventeen of the 305 patients (38%) had a historical diagnosis of osteoporosis found in their medical record. Of all patients, 44% were taking prescription osteoporosis treatment, most commonly a bisphosphonate (23% of all patients) or estrogen (22% of all patients).
Patient Demographics (n = 305)
Osteoporosis Screening
Of the 1248 total patients with office visits during our study period, 896 had had a BMD test completed since age 60 (72%) (Figure 1). This is contrasted by the 294 of 305 patients (96%) who were considered to have been screened for osteoporosis and had completed a GME in our practice during June to November 2007 (the “recent GME” group). Of these patients with a recent preventive visit, 255 had completed a DXA scan at our facility (87%) whereas 37 (13%) reported previous BMD testing elsewhere. Documentation showed that 2 patients were offered a DXA scan and declined it.

Patients with and without a preventive health examination visit and rates of osteoporosis screening. BMD, bone mineral density; GME, general medical examination; MCA, Mayo Clinic Arizona.
Of the 645 patients with GME billing during June 1997 to May 2007 (the “ever GME” group), 452 had completed a MCA DXA scan (70% screening rate) whereas 298 patients who had not completed a preventive visit at MCA completed BMD tests (50.3% screening rate for the “never GME” group). There was a significant association between having completed a recent GME and having had a DXA scan for osteoporosis screening. The “never GME” group was significantly less likely to have completed a MCA DXA scan than the “recent GME” group, who had a preventive visit within the period of June to November 2007 (odds ratio, 0.14; 95% CI, 0.09–0.21). The “ever GME” group, who had a previous preventive visit within the last 10 years but not during June to November 2007, was significantly less likely to have an MCA DXA scan than the “recent GME” group (odds ratio, 0.32; 95% CI, 0.22–0.47).
Physician Characteristics Associated with Screening
No statistically significant differences in the rate of screening were noted based on physician sex or status (attending versus resident physicians).
BMD Testing Results
Results of each patient's last DXA scan are shown in Table 2. Approximately 15% had osteoporotic T scores. Only 23% of patients had normal bone density with their most recent testing, with the majority having low bone mass. Thirty-seven patients had reported outside BMD testing, so therefore no results were available. Not surprisingly, lower patient weight and body mass index were significantly associated with a worse T score.
Results of Most Recent Bone Mineral Density Testing
Use of Prescription Osteoporosis Medication for Those with a Historical Diagnosis of Osteoporosis
Of 305 patients, 117 (38%) had a historical diagnosis of osteoporosis found in their medical records. Of these women, 58% were currently taking prescription osteoporosis medications. Not surprisingly, there was a significant association between having a diagnosis of osteoporosis and being treated with osteoporosis medicines (P < .0001).
Use of Prescription Osteoporosis Medications Based on Latest DXA Scan Results
For patients previously diagnosed with osteoporosis who still had a T score in the osteoporotic range with their latest test (ie, <−2.5), 77% were taking prescription osteoporosis medicines. Fifty-four percent of patients with a historical diagnosis of osteoporosis had improved T scores to between −1 and −2.5 on their latest test. Of these patients, 57% continued taking prescription therapies. Approximately 14% (15 of 108) of previously osteoporotic patients had improved to having a normal bone density (T score of >−1.0). Eighty-seven percent were no longer taking prescription osteoporosis medications. There was a statistically significant association between lower T scores and taking osteoporosis medicines (P < .0001). Only 4 patients without a historical diagnosis of osteoporosis actually had a T score worse than <−2.5 (ie, had osteoporosis but it went unrecognized by their physicians).
Discussion
Our study demonstrates that elder female patients who had recently completed a PHE (in our setting this was referred to as a GME) have extraordinarily high rates of osteoporosis screening (more than 96%). Patients who had seen our physicians for a GME at least once during the previous 10 years had screening rates somewhat higher than those reported in other more recent trials (around 70%). Those patients who did not have a preventive visit during the past 10 years were just as likely to have not completed screening has to have had it done.
Patient recall of having BMD testing was reported in the National Osteoporosis Foundation's Health Issues Survey.12 For patients aged 65 and older, 57% reported having completed osteoporosis screening. Gourlay et al13 repeated a similar cross-sectional survey in North Carolina in 2004, in which 50% of women aged 65 and older recalled having been screened.
A systematic review of 51 articles examined trends in BMD testing from 1992 to 2002 and found screening frequencies among at-risk patients were low, ranging from 1% to 47%.14 Trends in Medicare claims for BMD testing among 65-year-old patients increased by 50% between 1999 and 2005 (increasing from 8.4% in 1999 to 12.9% in 2005), whereas 30% of total female Medicare beneficiaries were noted to have been screened at least once.6
Soloman et al4 reported findings from their review of the EMRs of 6311 at-risk patients seen by 160 doctors at 10 Harvard-affiliated primary care sites during 2001 to 2002. Forty-five percent had had a previous bone density test, 30% had received a medication for osteoporosis, and 54% had one or the other. They reported large variations in practice patterns between sites (17% to 70% screening rates). Patients seen by male physicians were less likely to have care that was adherent with guidelines (odds ratio, 0.70; 95% CI, 0.55–0.89).
A more recent retrospective review of osteoporosis screening behaviors for women aged 66 and older occurred in a large, multisite primary care group practice.7 They found that the physician-specific osteoporosis screening rates varied form 12% to 97% whereas practice-site specific rates ranged from 26% to 91%. The overall screening rate was 56%.
We found that there were no specific physician-related factors that influenced osteoporosis screening rates (neither physician age nor sex). In their structured review of the literature, Morris et al14 found that male physicians, generalist doctors, and those caring for fewer postmenopausal patients were more likely not to test patients. They also found that, in terms of treatment, younger patients, men, patients without a history of fracture, and those without subspecialist care were at higher risk of not receiving pharmacologic treatments. Another study found providers who were high users of BMD testing had more female patients in their practice and were also more likely to be female themselves (62% vs 48%; P < .05).15 In addition, there was no association between use of BMD testing and age of provider or years in practice.
We feel our findings confirm those from other literature that both physician and patient awareness of the need for osteoporosis screening is increasing. Weiss et al5 reviewed practice behaviors of primary care physicians involved in the National Osteoporosis Risk Assessment Study. 1998 behaviors were compared with behaviors in 2006 and demonstrated that the percentage of National Osteoporosis Risk Assessment Study primary care physicians reporting that they use BMD testing “often” more than doubled (35% vs 87%), whereas the percentage of primary care physicians who reported that a T score of ≤−2.5 was the threshold indicating the presence of osteoporosis increased from 34% to 67%. These data, although encouraging, were gathered via a physician survey and not from actual patient care. The response rate was only 37% and may only represent those with the most interest in, knowledge of, and experience with osteoporosis management.
How Best to Insure Screening?
We believe that our data demonstrate that patients and physicians who feel that good preventive service care can be provided concomitantly with visits for chronic disease management or during acute care visits may be mistaken. It should be remembered that all of these patients in our study had a recent visit to our practice. Unless a woman presented herself to her physician with the explicit intent of reviewing her health maintenance issues and receiving screening and preventive services (and then did so recently) it seems that the chance of actually completing them may significantly decline.
Our practice emphasizes the importance of regular GME visits for our patients (even though it generates an out-of-pocket expense for Medicare beneficiaries). It seems that this emphasis is a common theme in primary care practices. Prochazka et al16 found, in their survey of more than 1600 primary care doctors, that 65% agreed that an annual physical examination is necessary. Fifty-five percent disagreed with national organizations that felt annual physical examinations should be abandoned in favor of more selective approaches to prevention. Eighty-eight percent of participating physicians reported performing such examinations. Most agreed that this provides time to counsel patients about preventive health services (94%), is desired by most patients, and helps foster better relationships with them.16
Although it is important that physicians value the PHE/GME visit, a growing evidence base also supports its use. A systematic review for the Evidence-Based Practice Center Program of the Agency for Health Care Research and Quality demonstrated that the PHE improves delivery of some recommended preventive services (particularly receipt of Papanicolaou smears, fecal occult blood screening, and cholesterol screening).17 This study also noted that there is some evidence that completion of the PHE may help lessen patient worry about their health. In addition, in a study of managed care enrollees eligible for cancer screening, PHE receipt was associated with significantly higher rates of completion of colorectal, breast, and prostate cancer testing.18
It has been clearly demonstrated that the provision of preventive services for older Americans is suboptimal.19,20 The face-to-face clinical encounter of the PHE seems to be a commonly used strategy. Crabtree et al21 noted that the clinical encounter with the physician or allied health clinician was the primary locus for delivering preventive services. Although several of the primary care practices included in their study had nursing and/or front office staff involved by sending reminders or having patients complete intake forms, it was up to clinicians to follow through in the examination room. We use a visit form that simply lists common preventive services. Whether this reminder (beyond the fact that the patient had presented herself to the office with the intent of having a PHE) impacted the rate of osteoporosis screening in our study is unknown. Evidence-based preventive care checklists have been shown to increase rates of service provision.22
Osteoporosis Recognition and Treatment
Many of our patients had received multiple BMD tests over the years and were previously diagnosed with osteoporosis (nearly 40%). In contrast to others’ findings,23 our doctors had recognized most of our patients who indeed had BMD testing diagnosing osteoporosis. Only 4 patients had T scores <−2.5 on their latest DXA scan without having an osteoporosis diagnosis in their medical records at the time of their GME visits.
Not surprisingly, a diagnosis of osteoporosis was significantly associated with being on an osteoporosis prescription therapy. However, only 58% of women with an osteoporosis diagnosis were using treatment at the time of their GME visit. This treatment rate, however, may not be as concerning as it first seems. Seventy-seven percent of women who had a previous osteoporosis diagnosis and had a persistently low BMD score (with their latest T score still <−2.5) were taking prescription therapy. During an era in which many patients and physicians have concerns about bisphosphonate and estrogen safety, the patients at the highest risk were still receiving appropriate therapy whereas many who had improved because of their treatments had discontinued. Prescription therapy need not be life long to provide success.
By comparison, Mountjoy et al24 completed a retrospective chart review of women aged 65 and older in their 2 university-affiliated outpatient family medicine clinics. Patients who had a diagnosis of osteoporosis (International Classification of Diseases-9 diagnosis code of 733.0) found in their EMR in 2006/2007 then had a follow-up phone survey in 2008 regarding their current treatment regimens. Of these patients, 57.5% were receiving pharmacotherapy for osteoporosis treatment.
We could improve updating our documentation of those patients who had successful treatment of their low BMD score. Of all patients with a recent GME, 38% “carry” the label of an osteoporosis diagnosis. Only 32% of these women, however, continued to have T scores still in the osteoporosis range with their latest tests (because of the successful effects of their current or previous treatments.) The majority of previously osteoporotic women no longer were so. Treatment for osteoporosis, at least in terms of improving bone density, can be highly successful.
Limitations
The rate of screening for the overall group might be underestimated and could actually be higher. We accepted a verbal report from the patient regarding testing outside of our institution for those within the 2007 “recent GME” group. We relied only on the current procedural terminology coding for a completed DXA scan for the rest of the patients. We would expect a similar proportion to have had testing elsewhere among the 1997 to 2007 “ever GME” group, and perhaps a higher percentage of testing completed elsewhere in the “never GME” group.
We have a small population of retired patients who are “winter visitors” to Arizona and have their primary residences elsewhere. They may have primary care physicians at home and may not rely on our practice to provide them with screening and preventive interventions. These patients might be expected to be highly represented in the “never GME” group and to have had screening of which we are unaware. However, we have not accepted new Medicare-age patients into our practice during the last few years and recently have required a permanent Arizona address for enrollment in our practice (making it less likely that we are enrolling “snowbirds” that are “pre-Medicare age”). For several years all new patients, regardless of age or insurer, have been required to have a GME visit at enrollment with our practice because of our emphasis on providing good preventive services. Perhaps this helps explain why only approximately 25% of the total group seen in 2007 had not had a GME completed with us during the past 10 years.
Our success in improving BMD testing in those patients with a historical diagnosis of osteoporosis may be overestimated. We accepted both a patient's report that she had osteoporosis (in the medical history portion of the medical record) and a physicians’ diagnosis of such in the problem list in our EMR as “evidence” of osteoporosis. Either of these attributions about the patient actually having a DXA scan with a T score <−2.5 could be in error. This potential, however, reflects the complexity of conducting research in a primary care outpatient setting and relying on a historical retrospective chart review, which may be imperfect compared with the enrollment of new patients in a secondary care, subspecialty setting for a prospective study.
Future Research
We have demonstrated that our physicians are successful in screening patients, identifying those with osteoporosis, and improving BMD test scores over time. We hope to implement a process of fracture risk assessment for patients with low BMD scores, which uses FRAX (the World Health Organization's fracture risk assessment tool).25 We hypothesize that many patient may underestimate their own fracture risk, as may their physicians. Using FRAX may identify those patients at increased risk of future insufficiency fracture and allow us to provide counseling and treatment interventions in a more proactive manner.
Conclusions
We reported osteoporosis screening rates in our practice for elder patients, which are much higher than reported in previous studies. There was a significant association between a woman having a recent dedicated PHE and receiving a DXA scan. We recommend consideration of beneficiary coverage for routine preventive visits by the Center for Medicare and Medicaid Services if similar results can be replicated in further studies of osteoporosis screening and other preventive services. In contrast to previously published literature, we were highly successful at screening women, identifying those who had abnormal BMD readings, and treating them successfully over time.
Notes
This article was externally peer reviewed.
This project was completed while MA, RG, MH, JH-H, LMM, and PS were Family Medicine residents at Mayo Clinic, Arizona.
Funding: Statistical analysis was funded by Mayo Clinic Arizona.
Prior presentation: This paper was presented as a poster at the North American Primary Care Research Group, Puerto Rico (November 2008).
Conflict of interest: none declared.
See Related Commentary on Page 602.
- Received for publication March 2, 2009.
- Revision received May 15, 2009.
- Accepted for publication May 19, 2009.


