
Abstract
Background: Previous research has found that wellness visits, recall and reminder systems, and standing orders are associated with higher rates of delivery of preventive services in primary care practices. However, there is little information about how to help practices implement these processes.
Methods: A 6-month randomized, controlled trial comparing a multicomponent quality improvement intervention to feedback and benchmarking. One clinician/nurse team from each of 24 practices was randomly assigned to one of 2 study arms. Intervention practices received performance feedback, peer-to-peer education (academic detailing), a practice facilitator, and computer (information technology) support. Implementation of the 3 targeted processes was determined by a blinded 3-clinician panel that reviewed transcribed clinician interviews before and after intervention using performance definitions. Rates of delivery of selected preventive services were determined by chart audit.
Results: Intervention practices implemented more of the processes than control practices overall (P = .003), for adults (P = .05), and for children (P = .04). They were also more likely to implement at least one of the processes for children (P = .04) and to implement standing orders for either children or adults (P = .02). Mammography rates increased significantly. Neither clinician and practice characteristics nor clinician readiness to change predicted implementation.
Conclusions: A multicomponent implementation strategy consisting of feedback, benchmarking, academic detailing, facilitation, and IT support increased implementation of evidence-based processes for delivering preventive services to a greater extent than performance feedback and benchmarking alone.
The published literature suggests that the most effective ways to increase the delivery of primary and secondary preventive services include implementation of nurse standing orders,1–3 decision-support systems,4–9 and wellness visits.10–12 Combinations of these processes are more effective than the individual ones.13–15
Helping primary care practices change their care processes is a challenge.16–20 A variety of approaches have been tried, including education, performance feedback with benchmarking, academic detailing, organizational assessment and practice re-engineering, practice facilitation, computerized decision support, and financial incentives like pay-for-performance. Multicomponent interventions work better than individual ones.21
Feedback with Benchmarking.
Primary care clinicians overestimate how well they deliver preventive services. However, there is little evidence that performance feedback alone changes clinician behavior very much in most cases.22,23 In addition to standard performance feedback, benchmarking compares individual performance to the performance of other practices to construct performance targets, generally at the 90th percentile. In a randomized controlled trial conducted by Kiefe et al,24 feedback with benchmarking resulted in greater improvements in diabetes care than feedback alone. However, in a majority of studies, these strategies alone have been relatively ineffective.
Academic Detailing
Academic detailing has been shown to be effective for changing certain clinician behaviors, including the delivery of smoking cessation counseling25 and appropriate use of antibiotics,26 although it was ineffective in increasing cervical cancer screening rates27 and implementation of depression management guidelines.28 A Cochrane review by O’Brien et al29 concluded that “educational outreach visits, particularly when combined with social marketing, seem to be a promising approach to modifying professional behavior, especially prescribing.” Our approach to academic detailing includes review and discussion of both published information and the methods used by local clinicians or practices who perform the desired function at a high level.30
Practice Facilitation
Nagykaldi et al31 recently reviewed the English language literature pertaining to the use and effectiveness of practice facilitators. Although there have been no randomized trials of practice facilitation apart from other complementary interventions, the literature suggests that this approach has value.32–39
Rogers40 refers to practice facilitators as “change agents.” He states that, “for this [type of communication/intervention] to be effective, the innovations must be selected to meet the client's needs,” and “feedback from the client system must flow through the change agent to the change agency so that it appropriately adjusts its programs to fit the changing needs of clients.” Our practice facilitators were called practice enhancement assistants (PEAs).
Information Technology
The Institute of Medicine Report “Crossing the Quality Chasm” states that “information technology (IT) has enormous potential to improve the quality of health care with regard to all 6 of the aims” set forth in the report (safety, effectiveness, patient-centeredness, timeliness, efficiency, and equity).41 IT applications can be used to enhance translation by giving clinicians and office staff tools that both facilitate and require changes in their office systems. Once these changes have been made, the existence of the technology may make it more difficult for the practice to revert back to previous processes.
The Preventive Services Reminder System (PSRS), an IT application that we helped to develop, delivers real-time immunization and preventive services reminders to clinicians and can be used to send reminder notices to patients.42 PSRS prompts are based on current United States Preventive Services Task Force and Advisory Committee on Immunization Practices recommendations. Flow sheets, immunization records, and audits are generated. The PSRS did not interface directly with the electronic health records being used in the practices.
The purposes of the present study were to (1) determine the effectiveness of our multicomponent intervention on implementation of 3 processes previously shown to be associated with increased delivery of preventive services: nurse standing orders, reminder/recall systems, and wellness visits; (2) identify contextual facilitators and barriers to the implementation of the 3 processes; and (3) measure the impact of the intervention on rates of delivery of preventive services. The multicomponent intervention tested in this study included feedback with benchmarking, academic detailing, practice facilitation, and IT support.
Methods
Study Design
This was a randomized controlled trial examining the combination of audit with feedback and benchmarking, academic detailing, practice facilitation, and IT support compared with feedback and benchmarking alone on implementation of wellness visits, recall and reminder systems, and standing orders in primary care practices (Figure 1). The primary outcomes were the number of practices who implemented one or more of these evidence-based processes and the total number of processes implemented, as determined by a blinded expert panel from transcripts of structured clinician interviews conducted at baseline and after a 6-month intervention period.
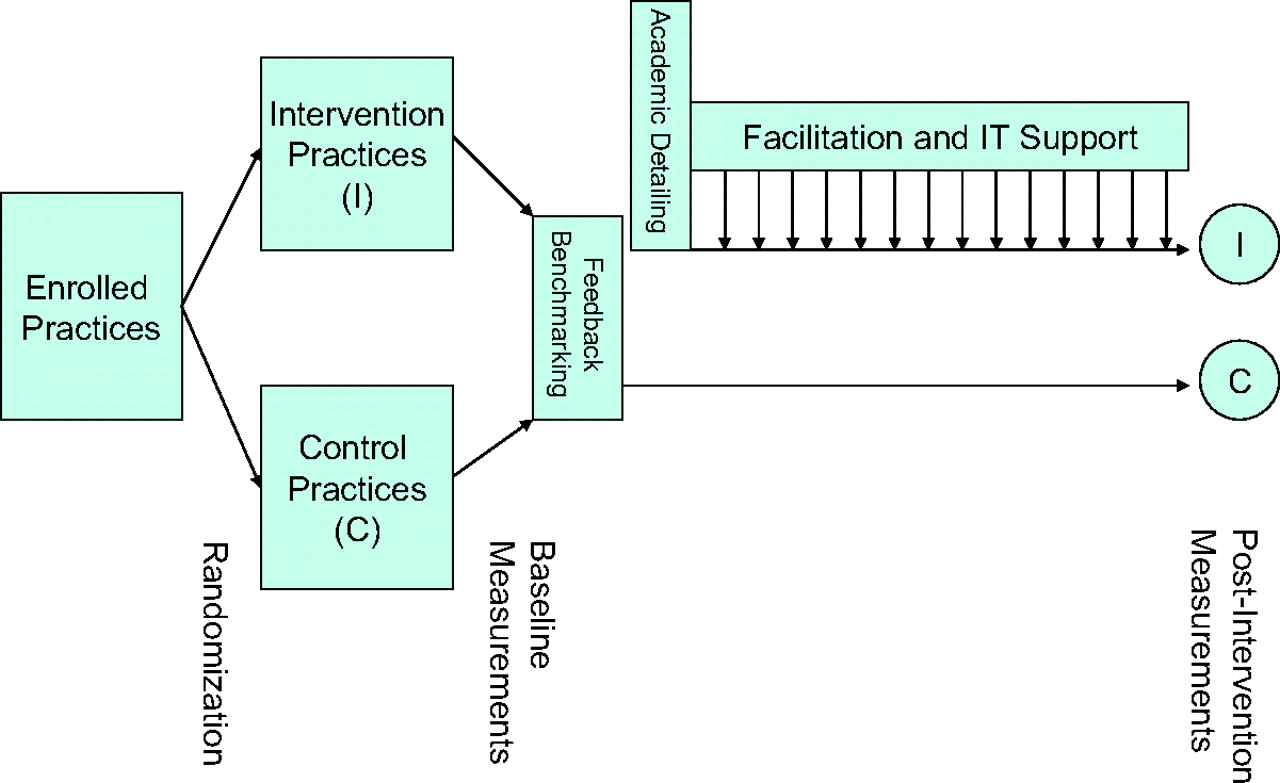
Randomized trial comparing feedback and benchmarking to a multicomponent implementation intervention that also included academic detailing, practice facilitation, and IT support.
Recruitment, Enrollment, and Randomization
The study population included clinician members of the Oklahoma Physicians Resource/Research Network, who were notified of the study via listserv, fax, and personal calls by the principal investigator (JWM). Of the 94 eligible practices in the network, 24 (25%) agreed to participate in this project. Practices were eligible to participate if individual clinicians and their nurses were able to make changes in the care process and/or had the full support of other relevant members of the practice, provided care to either 2- to 3-year-olds or 50- to 75-year-olds or both, and saw more than 30 patients per week.
One clinician from each practice was recruited and enrolled as described below. Although more than one clinician from a practice could be involved, one clinician from each practice was designated as the primary clinician participant at that clinic, and all outcome data were collected from that clinician and his/her patients’ records. This allowed us to avoid statistical issues relating to clinicians clustered within practices.
The purpose and experimental nature of the project was explained to the clinicians, their nurses or medical assistants, and their clinic administrators, who signed informed consent documents approved by the University of Oklahoma Institutional Review Board and all other applicable institutional review boards. The 24 practices were then randomized, within blocks of 4 using a series of coin tosses, to intervention and control groups of 12 practices each. It was not possible to completely blind participating clinicians. They were told that we were studying their ability to implement changes in their office systems designed to improve their rates of delivery of preventive services, and that some participating practices would receive more assistance than others.
Baseline Data Collection
At baseline, participating clinicians were asked to verify information contained in the Oklahoma Physicians Resource/Research Network database about themselves and their practices. They completed paper and pencil surveys containing questions about (1) the perceived importance to them of selected immunizations and preventive services; (2) their estimation of the rates at which their patients were receiving those services; and (3) their level of confidence that they could increase their delivery of the services by 10% during the study period. Intervention clinicians were also asked to rate (1) their readiness to increase delivery of those preventive services; (2) their level of confidence in the practice's ability to institute recall and reminder systems, standing orders, and wellness visits (rated individually); and (3) important barriers to the implementation of each of these processes in their practice. All clinicians completed (self-administered with PEA assistance if requested) an Assessment of Chronic Illness Care (ACIC) survey instrument (version 3.5, modified by us for preventive services).43 The ACIC instrument yields scores for each of 7 subsections (0–11) and a mean overall score (0–11) that represents the degree to which the practice has implemented the components of the chronic care model.44,45
Clinicians in both groups were interviewed by a research assistant, blinded to group assignment, about whether and the extent to which they were using nurse standing orders; a decision-support system providing prompts, reminders, and recalls; and/or special immunization or preventive services clinics. The interviews followed a strict protocol and were audiotaped and transcribed.
The research assistant audited the medical records of a random sample (from a computer-generated randomized numbers lists) of fifty 50- to 75-year-olds and fifty 2- to 3-year-olds seen by the index clinician within the previous 4 months. One hundred adult charts were audited in practices that saw only adults. Selected preventive services were considered up-to-date based on the following criteria: DTaP#4, measles/mumps/rubella, HepB#3 and Pneumovax if ever received; mammography, if received within the past 2 years; and colorectal cancer screening if fecal occult blood testing was received within 1 year, flexible sigmoidoscopy if received within 5 years, or colonoscopy if received within 10 years. First visits to the practice were not excluded.
Intervention
At baseline, clinicians in both groups were given a report listing their rates of delivery of selected preventive services including DTaP#4, measles/mumps/rubella #1, and HepB#3 for 2- to 3-year-olds; and pneumonia vaccination, colorectal cancer screening, and mammography for 50- to 75-year olds. Benchmark rates (90th percentiles) were determined from clinician audits done as part of another study done in the previous year that involved 50 network clinicians.
The principal investigator (JWM), a practice facilitator (PEA), and an IT professional met with individual intervention practices (clinicians, nurses or medical assistants, and clinic administrators) for 90 minutes over lunch to discuss the 3 evidence-based processes and how they were being or might be applied in their practices. Supporting materials were supplied in a notebook that was left with the practice. The PEA assigned to that practice was introduced and her role was clarified, a schedule of visits was agreed upon, and a tentative agenda or set of tasks for the PEA was discussed. The IT professional briefly demonstrated the PSRS application and offered to install it in interested practices.
The PEA was available, on average, one-half day per week to help the staff to implement the office system strategies. Types of assistance offered included organizing staff meetings; facilitating incremental, short-cycle improvements; investigating billing and reimbursement issues; developing or modifying forms; training staff; auditing charts; sharing ideas and methods from other practices; and communicating problems, needs, and requests to the IT programmer. The actual services provided to each practice were different based upon their specific needs and requests.
If the practice chose to use the PSRS, the IT professional made additional visits to load active patients’ demographic information from the practice's billing system into the application and teach the nurses or medical assistants to use it.
Data Collection After Intervention
Six months after the academic detailing visits, clinicians in the intervention group completed a follow-up survey asking about the barriers they encountered when implementing each of the processes. They also completed the ACIC instrument.
The research assistant again conducted blinded, structured, audiotaped interviews with clinicians in both groups about whether and to what extent they were using each of the targeted processes in adults and children. One of the researchers (CBA) subsequently conducted audiotaped exit interviews with the PEAs, asking them the same questions.
The research assistant again audited the medical records of a random sample (from a computer-generated randomized numbers lists) of fifty 50- to 75-year-olds and fifty 2- to 3-year-olds seen by the index clinician within the previous 4 months. One hundred adult charts were audited in practices that saw only adults.
Outcome Measures
A committee of 3 academic family physicians not otherwise involved in the project analyzed 6 sample interview transcripts and then met to operationalize the existing definitions for the 3 processes. These definitions were then tested on 6 additional sample transcripts and further refined. Modifications were required to differentiate practices that used the processes occasionally from those who were using them consistently. Interview questions were then created to capture the required information. Implementation of the 3 processes by study participants was determined by consensus of the same 3 physicians, blinded to group assignment and to baseline or follow-up status. Committee members scored the transcripts independently and then met to resolve differences. Each practice received up to 6 separate dichotomous scores (0,1) for the 3 processes for adults and for children (maximum: 3 + 3 = 6). Practices that saw only adults received only 3 scores. The operational definitions used for the 3 evidence-based processes follow.
Standing Orders
Use of specific, formal protocols, policies, and procedures that authorize office nurses, medical assistants, other nonclinical office staff or pharmacists affiliated with the practice to deliver immunizations and/or other preventive services without checking with the clinician first. The protocols, policies, and procedures must be in active use with more than 50% of patients and must apply to more than a single immunization or preventive service. They need not be in written form.
Reminders
Paper-based or electronic techniques for reminding clinicians, nurses, and/or other clinic staff to recommend or perform preventive services when they are due or overdue. Reminder systems may also be, but are not required to be, used to remind patients that they are due for preventive services. An auditable registry is desirable but not required. The prompt and reminder system or systems must be used more than 50% of the time and must apply to more than a single immunization or preventive service.
Special Immunization/Prevention Clinics
Specific types of visits (eg, well-child and well-adult visits) and/or time periods (eg, immunization clinics, prevention group visits) devoted primarily to provision of preventive services. These visits or time periods must be provided to more than 50% of patients and must apply to more than a single immunization or preventive service.
Process Measures
The following process variables were measured: (1) attendance at initial meetings with practices; (2) number of visits by the PEAs to each practice and total contact time with clinicians and staff; (3) number of visits by the IT professional to each practice; and (4) number and proportion of clinicians involved in each practice. The PEAs also wrote progress notes after each visit, which were reviewed by the principal investigator for important themes.
Statistical Analyses
Analyses of the primary outcome measures included comparisons of the following variables between intervention and control groups: (1) proportion of total opportunities for implementation of the processes (ie, processes not already in place at baseline) in which the processes were implemented; (2) the proportion of practices implementing any of the 3 processes for children or adults when an opportunity existed to implement them; and (3) the proportion of practices implementing each of the 3 processes when opportunity existed to implement them. These comparisons were made using the binomial comparison of proportions.
Associations between the variables obtained from the surveys before and after intervention, clinician and practice characteristics, and the adoption of one or more of the strategies (ie, improvement = yes/no) were analyzed by logistic regression modeling. Rates of change of delivery of preventive services were compared using independent t tests. Changes from baseline to final ACIC scores were compared using paired t tests.
Power Analysis
The study was powered to have a better than 80% chance to detect an implementation rate twice as high in the multicomponent intervention group, assuming between 36 and 48 opportunities per group.
Results
Table 1 lists the characteristics of the clinicians and practices enrolled in the study. In the intervention group, 11 of the 12 clinicians were family physicians; the other was a physician assistant. In the control group, 11 of the clinicians were family physicians and the other was a general internist. The practices ranged in size from single clinician practices to a Federally qualified community health center with 6 clinicians. Two practices (one in each group) were residency training sites. Baseline ACIC scores ranged from 2.4 to 10.1.
Characteristics of Practices and Clinicians at Baseline
Clinicians assigned to the intervention group were more likely to be rural. Those assigned to the control practices were less likely to see children. In addition, one control group practice had already implemented all the proposed processes and so had no opportunity for improvement. As a result, intervention practices had a total of 38 opportunities for improvement whereas control practices had only 23. Intervention practices were more often rural. Aside from this, intervention and control practices did not differ in size or baseline ACIC score and clinicians from the 2 groups did not differ in number of years in practice, level of autonomy, or perceived importance of preventive services (Table 1).
Table 2 lists the primary outcome variables for both intervention and control practices for both adults and children. The P values shown are 2-tailed, which provides a conservative estimate of the statistical significance of the results. Clearly, standing orders were easiest to implement, followed by recall and reminder systems, followed by wellness visits. None of the practices actually recalled patients for preventive services. Mean (SD) changes in the ACIC scores were 0.77 (1.72) for the intervention practices and −0.49 (1.74) for the control practices (P = .09). In one of the control practices, the use of wellness visits in children fell below the threshold during the study (coded as present at baseline and absent after intervention). This was not considered in the statistical analyses.
Primary Outcome Measures (Adoption of Evidence-Based Strategies)
None of the clinician or practice characteristics which included size of practice, location of practice, clinician number of years in practice, clinician decision making authority, clinician perceived importance of prevention, initial mean ACIC score, baseline estimates of performance, and actual performance at baseline, predicted whether a practice would implement one or more of the evidence-based approaches. The only significant predictor was group assignment (P = .05). Clinician and practice characteristics also failed to predict number of approaches implemented, which was predicted by group assignment (P = .05) and the number of implementation opportunities (P = .04). There were no meaningful correlations between level of readiness to improve or confidence in the practice's ability to improve and actual improvement.
Table 3 includes baseline and postintervention rates of delivery of selected preventive services. For all services except colorectal cancer screening, the intervention group improved more than the control group, although the differences were only statistically significant for mammography (P = 0.04).
Changes in Rates of Delivery of Selected Preventive Services
Five facilitators were involved in the project, each working with one to 3 practices (Table 4). They made weekly contacts with the practices, either in person (90% of the contacts) or by phone. The average number of visits made by the facilitators to each practice was 18 (range, 8–42) and the average total contact time with the clinicians was 446 minutes (7.4 hours; range, 80–2640 minutes). There was no significant correlation between the number of facilitator visits or contact time and the number of processes implemented. There was also no evidence that some facilitators were more effective than others. One of the practices decided to add a prevention nurse. The facilitator spent 2640 minutes with that clinician in 42 visits.
Amount of Support and Measures of Improvement in Multi-Component Intervention Practices
Facilitator field notes documented that none of the practices held regular mandatory staff meetings before this project. Scheduled facilitator meetings were frequently changed or cancelled at the last minute because of patient care issues, clinician and staff illnesses, vacations, or scheduling errors. The idea of “Plan-Do-Study-Act” cycles was helpful, but the cycles rarely went as planned. Most of the practices had either recently implemented an electronic health record or were about to implement one. Two were in the middle of major moves or renovations of their offices.
The IT professional helped 4 of the intervention clinicians try to implement the PSRS software, 3 of whom did so successfully (Table 4). He provided advice to several practices regarding the choice of an electronic health record with respect to recall/reminder functions. On average, he made 2 trips to each intervention group practice (range, 1–5). There were no significant associations between the number of IT support visits and the number of processes implemented.
Discussion
The multicomponent translational intervention was effective in these self-selected, motivated small primary care practices. Standing orders and recall and reminder systems, which were easier to implement than routine wellness visits, were implemented more often. As expected, implementation of the evidence-based processes seemed to result in increased delivery of all the preventive services that we measured, but the study was underpowered and too short in duration to show statistical significance for this secondary outcome measure.
This multicomponent implementation strategy has also been effective for improving the quality of care provided to diabetic patients,46 for increasing mammography rates,47 and for increasing rates of screening and interventions for unhealthy behaviors (unpublished). Other researchers have been successful using similar strategies. For example, Baskerville et al48 reported their successful introduction of effective preventive service delivery processes into a group of Canadian practices using a strategy that included audits with feedback, clinician education provided by opinion leaders, practice facilitators, within-practice consensus building, patient education materials, and the choice of a manual or computerized reminder system.
The cost of our intervention per practice was approximately $7,500 for the 6-month implementation. Hogg et al49 analyzed the overall cost-effectiveness of their similar intervention, finding that, despite the high cost of facilitation, considering the increased rate of delivery of key preventive services the intervention was cost-effective.
Six months was barely enough time to effect these changes in most of our practices. This was partly because of the many other changes the practices were making on an ongoing basis. Even these practices, which chose to join a practice-based research network and then chose to be a part of a major quality improvement project, were unlikely to have implemented a majority of the components of the Chronic Care Model. They were extremely unlikely to have blocked out time to do quality improvement on a regular basis. We were unable to predict which practices would succeed using a variety of standard clinician and practice variables. This remains an important area for further study.
We did not specifically include measures of the practice's or clinician's priority for making the recommended changes or the practice's change process capability as specified in Solberg's Quality Improvement Model.50 We did use the ACIC instrument to measure care process content and found no correlation with implementation. The lack of correlation of improvements with baseline practice characteristics might suggest that the multicomponent intervention can be effective across a range of practices and clinicians.
Our study has some limitations. The control practices had fewer opportunities to improve. Although the statistical analyses took that into account, it is still possible that this baseline difference could have unduly favored the intervention group. Blinding of the practices was impossible. The intervention clinicians knew that we were investing a great deal of time and effort into helping them implement the evidence-based approaches. This could have influenced their responses to the interview questions, leading them to overestimate the degree of implementation compared with the control clinicians. The trends seen in preventive service delivery rates are reassuring. Unfortunately, we were unable to conduct follow-up interviews to determine the extent to which the improvements were sustained and preventive services delivery rates continued to rise.
Conclusions
A multicomponent intervention that included performance feedback with benchmarking, academic detailing, practice facilitation, and IT support was more effective than performance feedback with benchmarking alone on the implementation of processes associated with increased delivery of preventive services in a group of primary care practices. The cost per practice was relatively high, but cost could possibly be reduced by integration within a continuous quality improvement infrastructure involving multiple practices.
Note
The Assessment of Chronic Illness Care (ACIC) survey instrument (version 3.5, modified by the authors for preventive services) mentioned in the article is available from the corresponding author by request.
Notes
This article was externally peer reviewed.
Funding: Supported by a grant from The Agency for Healthcare Research and Quality (5 R21 HS041850-02) for the project period of September 30, 2004, through September 29, 2006.
Conflict of interest: none declared.
See Related Commentary on Page 258.
- Received for publication January 9, 2008.
- Revision received April 28, 2008.
- Accepted for publication April 29, 2008.
References
In this issue


Jump to section
Related Articles
Cited By...
- Facilitation roles and characteristics associated with research use by healthcare professionals: a scoping review
- Meaningful Use in Chronic Care: Improved Diabetes Outcomes Using a Primary Care Extension Center Model
- A Practice Facilitation and Academic Detailing Intervention Can Improve Cancer Screening Rates in Primary Care Safety Net Clinics
- Preventive Services Delivery in Patients With Chronic Illnesses: Parallel Opportunities Rather Than Competing Obligations
- The Primary Care Extension Program: A Catalyst for Change
- Implementing and Evaluating Electronic Standing Orders in Primary Care Practice: A PPRNet Study
- A Randomized Colorectal Cancer Screening Intervention Trial in the Iowa Research Network (IRENE): Study Recruitment Methods and Baseline Results
- Systematic Review and Meta-Analysis of Practice Facilitation Within Primary Care Settings
- Third Journal of the American Board of Family Medicine Practice-based Research Theme Issue